


공식 공급 업체
200 이상의 소프트웨어 개발처와 판매 계약을 맺은 공인 디스트리뷰터로서 합법적인 라이선스를 제공합니다.
모든 브랜드 보기.

Executable file authoring capabilities within installation tools streamline the deployment process for developers. By integrating the installation logic directly into the executable (.exe) file, users simply need to run this single file. This eliminates the need for separate installers and automates tasks like file copying, registry modifications, and shortcut creation, ensuring compatibility with the target Windows environment.
Several installation tools offer EXE authoring including:
For an in-depth analysis of features and price, visit our Installation Tools comparison.
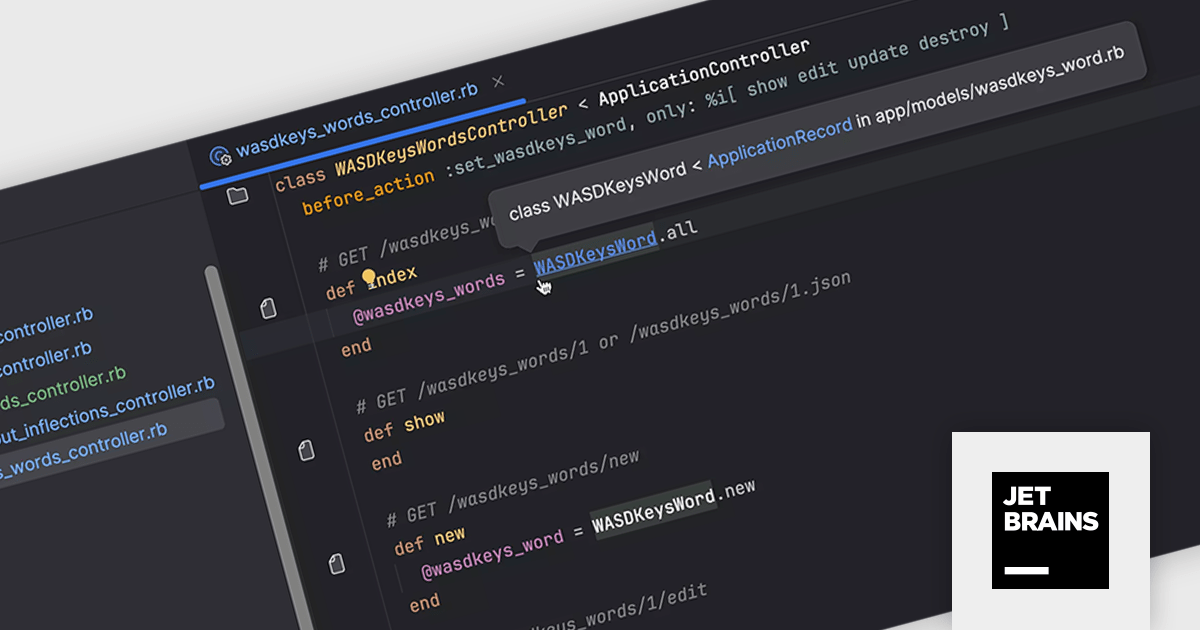
RubyMine by JetBrains is a powerful Integrated Development Environment (IDE) specifically designed for Ruby and Ruby on Rails development. It offers a comprehensive suite of features to boost your coding efficiency, including smart code completion, syntax highlighting, code refactoring tools, built-in debugging and testing frameworks, and seamless integration with popular libraries and databases. Whether you're a seasoned Rails developer or just starting out, RubyMine's intuitive interface and robust features can help you write cleaner, more maintainable code and accelerate your development workflow.
RubyMine 2024.1 enhances workflow efficiency for developers who utilize custom inflections in their Ruby projects. This update ensures seamless recognition of class and file names with these custom conventions, eliminating inconsistencies. Project view, tabs, and the Search Everywhere dialog now display the correct icons for these custom-inflected elements. Navigation and code insight functionality remain fully functional, even extending to acronyms used in controllers and models.
To see a full list of what's new in version 2024.1, see our release notes.
RubyMine is licensed per user, and is available as a commercial annual subscription license. We can supply new subscriptions, subscription renewals (including continuity discounts), lapsed renewals, and additional user licenses. See our RubyMine licensing page for full details.
For more information, visit our RubyMine product page.
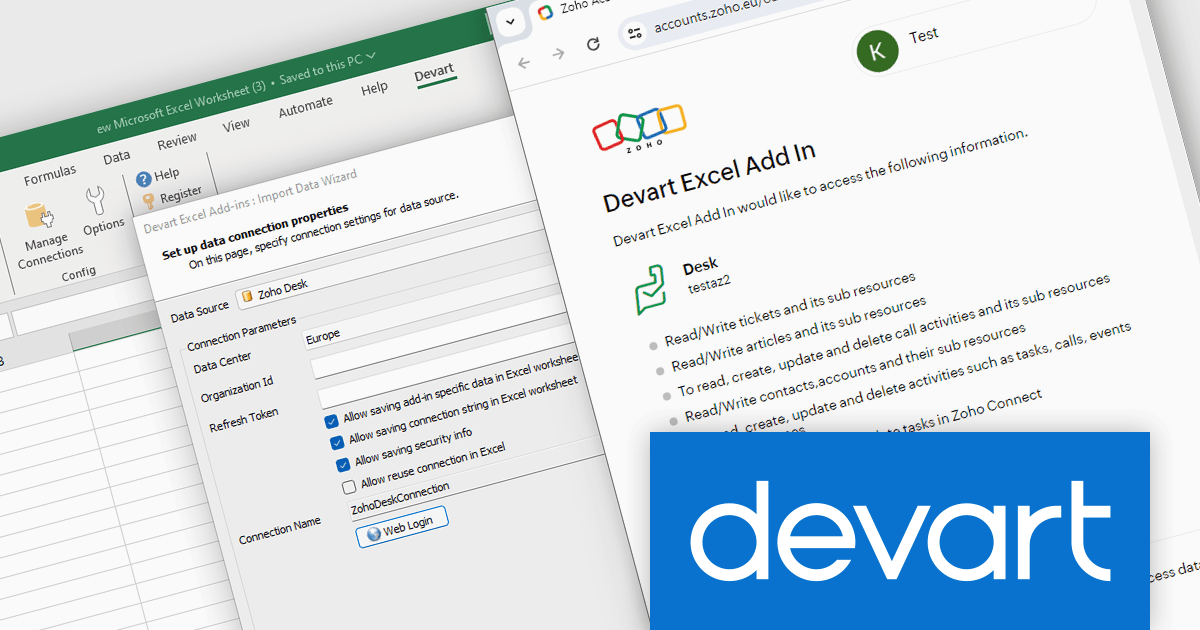
Devart Excel Add-in for Zoho Desk bridges the gap between your Zoho Desk helpdesk data and the familiar environment of Microsoft Excel. This powerful tool allows you to seamlessly import, edit, and update your Zoho Desk information directly within Excel spreadsheets. By leveraging Excel's robust data analysis features, the Devart add-in empowers users to gain deeper insights from their customer support data.
This integration unlocks a multitude of use cases for Zoho Desk users. Teams can leverage the add-in to generate comprehensive reports on ticket volume, agent performance, and customer satisfaction. The ability to edit data in Excel enables bulk updates to ticket statuses, classifications, and even custom fields within Zoho Desk. This streamlined data manipulation fosters improved efficiency and facilitates data-driven decision making for your customer support operations.
Devart Excel Add-in for Zoho Desk is licensed per user and is available as a Perpetual license with 1 year support and maintenance. See our Devart Excel Add-in for Zoho Desk licensing page for full details.
Devart Excel Add-in for Zoho Desk is available in the following products:
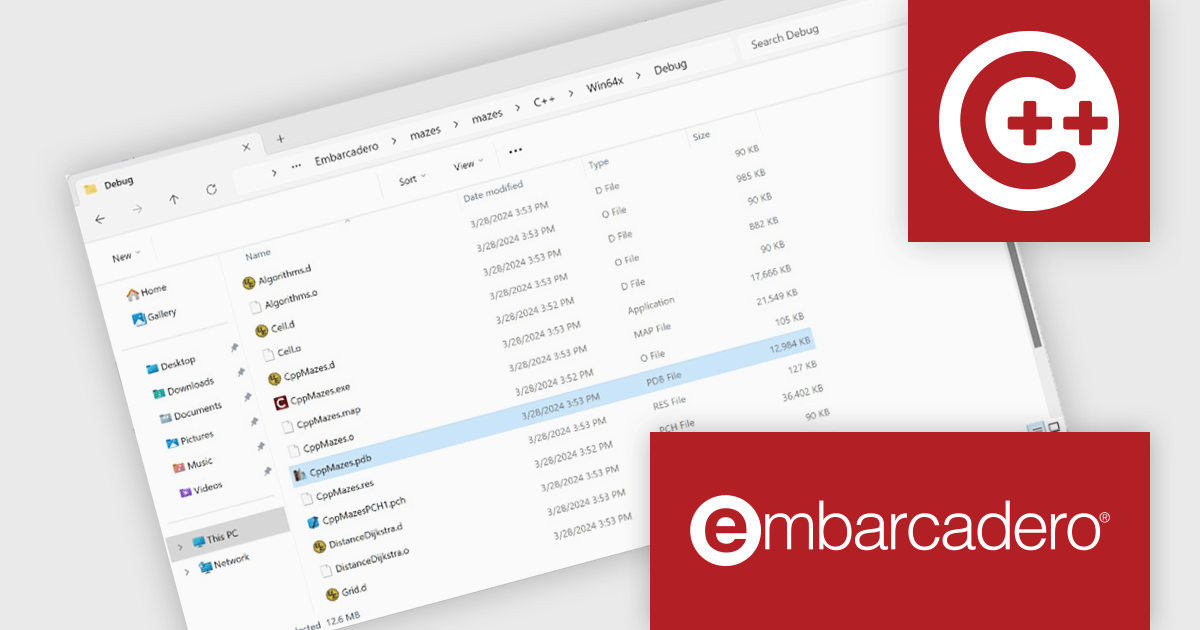
C++Builder by Embarcadero is a rapid application development environment that simplifies C++ development for Windows, iOS, macOS, and Android. It streamlines the process by offering visual UI design tools, pre-built components, and a powerful debugger, enabling faster creation of high-performance native applications.
The C++Builder 12.1 Athens update includes a brand new Clang-based C++ compiler that brings modern development to 64-bit versions of Windows. This high-quality toolchain offers a powerful 64-bit compiler and linker, ideal for large applications. Seamless integration with external libraries and existing C++ code ensures a smooth transition. Full IDE integration and support for VCL, FireMonkey, FireDAC, and RTL libraries make it a complete solution for modern C++ development on Windows.
To see a full list of what's new in C++Builder 12.1 Athens, see our release notes.
C++Builder Professional, Enterprise and Architect are licensed per Named, Network Named or Concurrent user and are available as a Perpetual License with an Update Subscription that includes support and free upgrades for 1 Year. C++Builder Professional is also available as a Named Annual user license. See our C++Builder licensing page for full details.
C++Builder is available to buy in the following products:
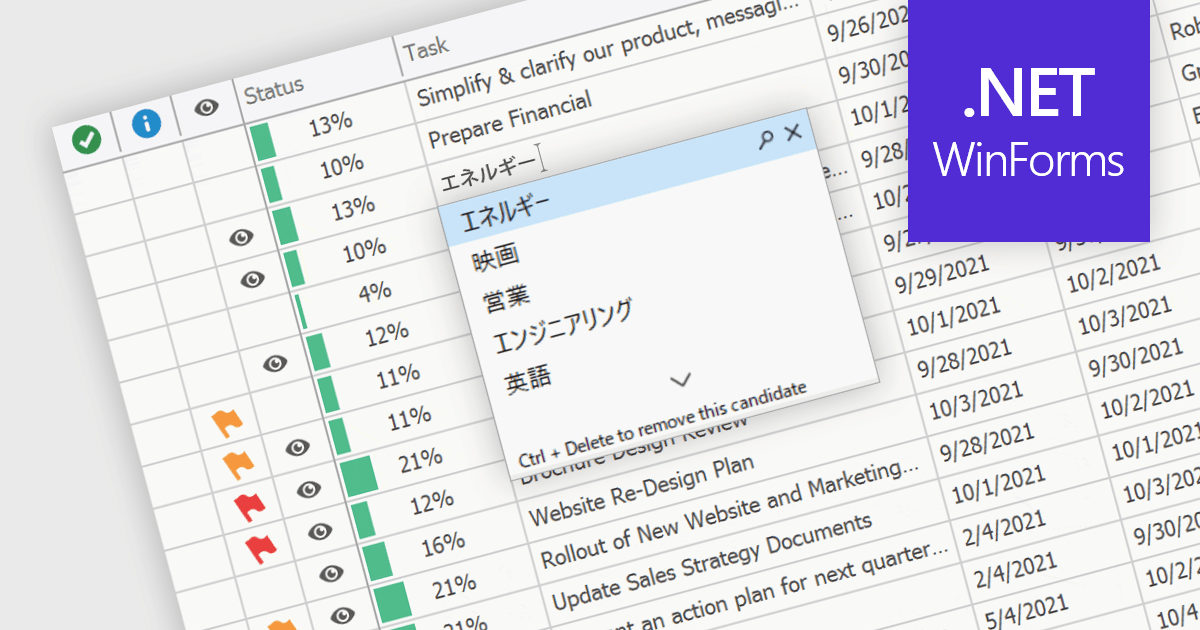
An Input Method Editor (IME) facilitates the entry of complex characters and scripts not directly supported by standard keyboards, which is especially vital for languages with extensive character sets like Chinese, Japanese, and Korean. When integrated into a grid component, an IME enables users to input text directly into data cells using phonetic or syllabic methods that are converted into the desired characters. This integration streamlines the data entry process in applications requiring multi-language support, significantly enhancing usability and efficiency. It simplifies the development of applications targeting global markets by providing native language input support, thereby improving the user experience and reducing the need for external language input tools.
Several WinForms grid components offer Input Method Editor (IME) support, including:
For an in-depth analysis of features and price, visit our comparison of WinForms grid components.
전화 : 00798 14 800 6332
팩스 : +1 770 250 6199


