


공식 공급 업체
200 이상의 소프트웨어 개발처와 판매 계약을 맺은 공인 디스트리뷰터로서 합법적인 라이선스를 제공합니다.
모든 브랜드 보기.
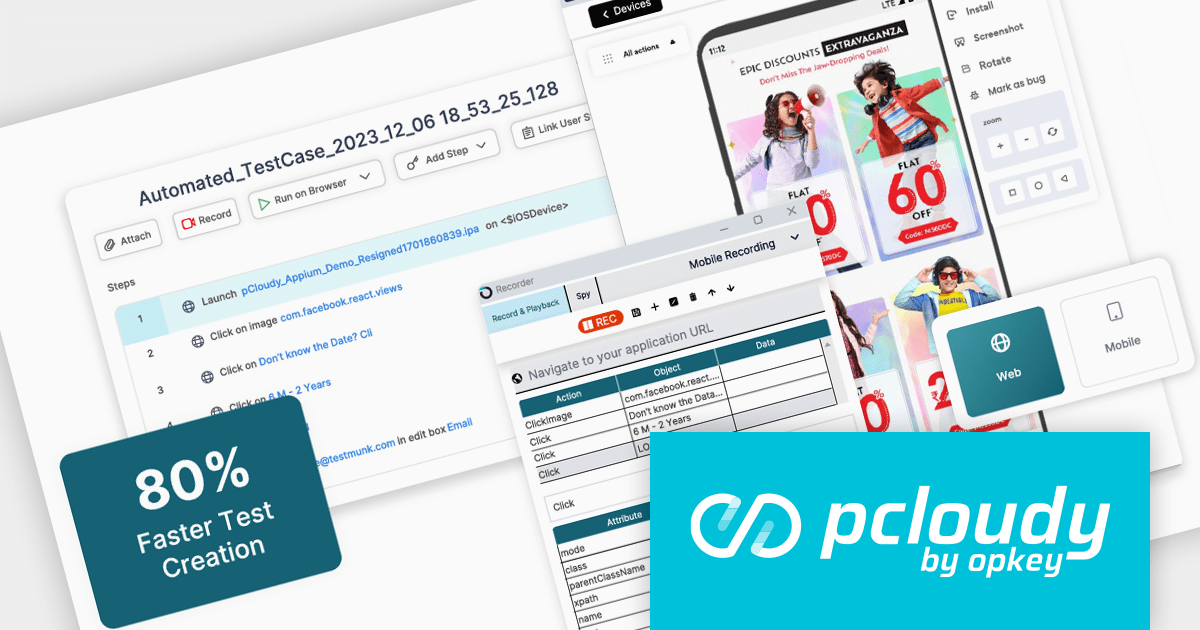
Pcloudy is a unified app testing platform that helps developers and testers ensure the quality and functionality of their applications across a wide range of devices and browsers. It provides a cloud-based infrastructure for manual and automated testing, offering access to thousands of real devices and browser combinations.
Pcloudy's 2024 platform streamlines app testing with a unified solution, catering to testers of all experience levels. Its codeless development tools and AI-powered features empower even non-technical testers to contribute. The platform boasts a comprehensive infrastructure of over 5,000 real devices and integrates seamlessly with CI/CD pipelines for efficient, future-proof testing across web, mobile, and desktop applications. This ensures flawless digital experiences and democratizes quality assurance, fostering collaboration within teams.
To see a full list of what's new in 2024, see our release notes.
Pcloudy is offered as a 1 Year Subscription, licensed per user, per parallel session. Licenses are available for Manual or Automated Testing, for Web or Mobile. See our Pcloudy licensing page for full details.
For more information, visit our Pcloudy product page.
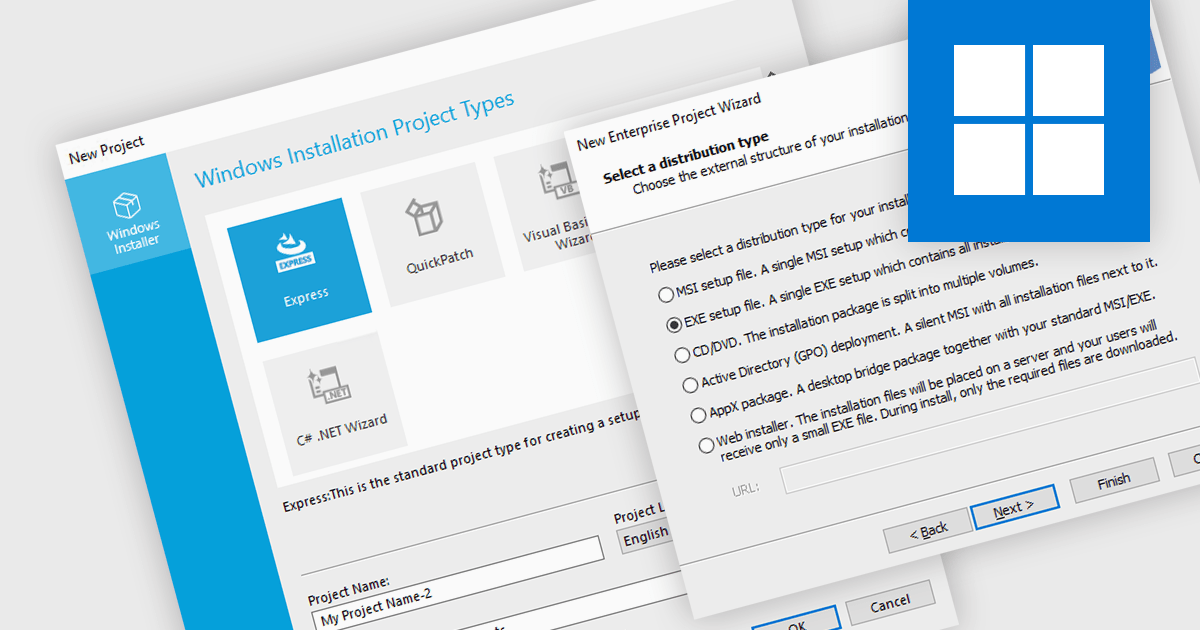
A new project wizard is a guided interface that assists users in creating an installer. It simplifies the process by presenting options and collecting necessary information step-by-step, saving time and reducing errors compared to manual configuration. They are user-friendly regardless of your experience, and are particularly helpful for complex projects with various settings, languages, or dependencies.
Several installation tools offer a new project wizard, including:
For an in-depth analysis of features and price, visit our comparison of installation tools.
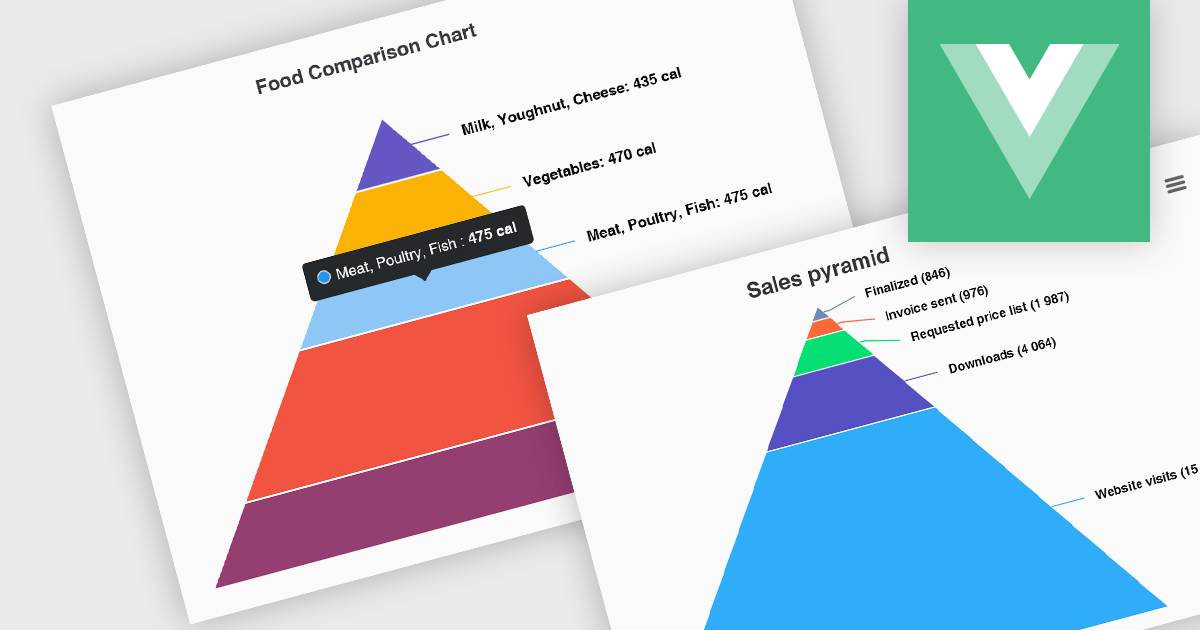
Pyramid charts, also known as triangle diagrams, utilize a triangular shape segmented into horizontal sections, each representing a level in a hierarchy, process, or simple dataset. Their strength lies in visually depicting hierarchical relationships, emphasizing the relative importance or size of each level through varying widths. The easily understood layout makes them ideal for communicating clear, singular data points in fields like sales funnels, population structures, and educational concepts.
Several Vue.js chart controls offer pyramid charts including:
For an in-depth analysis of features and price, visit our Vue.js chart controls comparison.
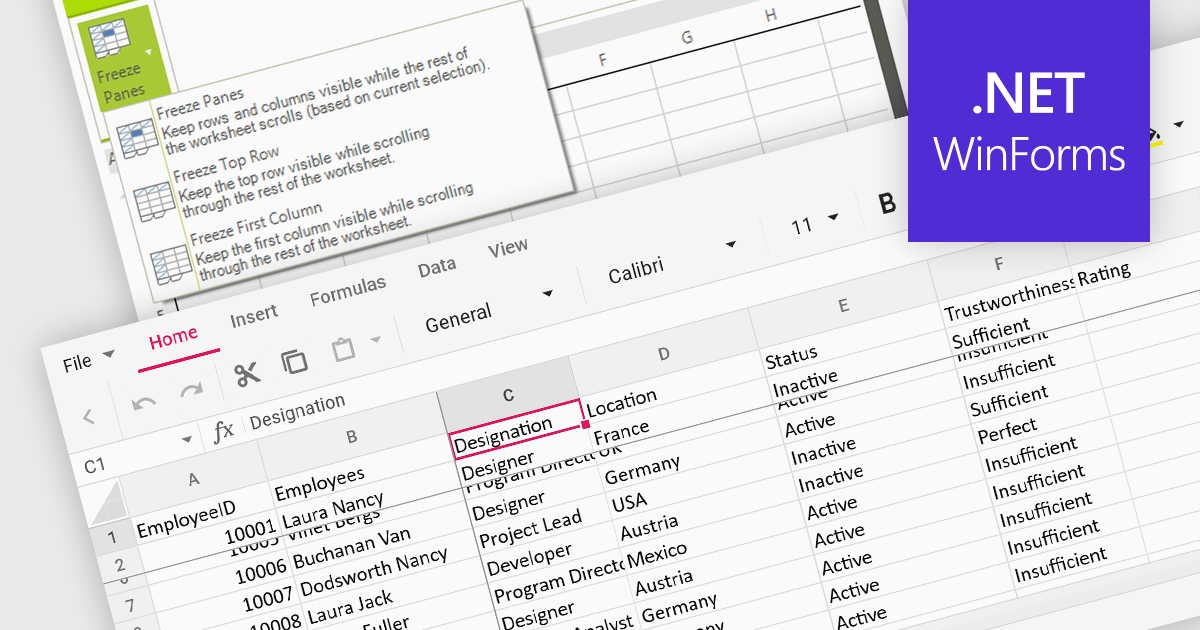
Freeze pane support allows you to fix specific rows or columns in place while scrolling through the rest of the data. This is particularly useful for large spreadsheets with header rows or key columns you need to reference constantly. By freezing panes, you ensure these crucial elements remain visible even as you navigate across vast datasets, improving readability and data analysis efficiency.
Several WinForms spreadsheet controls offer freeze pane support including:
For an in-depth analysis of features and price, visit our WinForms spreadsheet controls comparison.
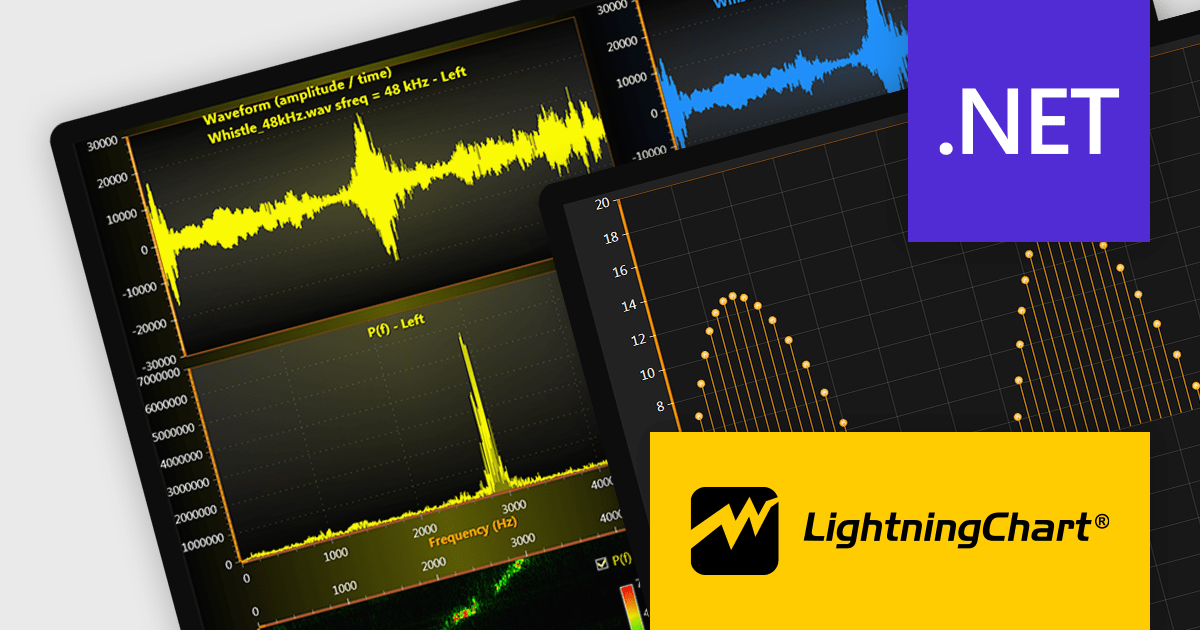
LightningChart .NET is a 2D and 3D data visualization SDK empowering developers with high-performance and flexibility. Boasting over 100 chart types, advanced technical indicators, and real-time rendering capabilities, it handles demanding scientific, financial, and engineering challenges, while its rich API and comprehensive support equip developers to craft informative and interactive dashboards.
The LightningChart .NET v11.0.1.1 release enhances text rendering fidelity in WinForms applications, ensuring exceptional clarity and readability across diverse screen resolutions and DPI configurations. This update guarantees a visually consistent and crisp user experience, independent of the user's device display characteristics. Additionally, it optimizes per-monitor DPI awareness for text rendering in both WinForms and WPF applications, particularly within the .NET 6 build environment. This refinement assures well-rendered and accurately scaled text across multiple monitors with varying DPI settings.
To see a full list of what's new in v11.0.1.1, see our release notes.
LightningChart .NET is available per developer in packages for either WPF, WinForms, UWP or all 3. Each package comes as a subscription license (with 1 or 2 years of limited support), or a perpetual license (with 1 or 2 years of Standard or Premium support). Floating licenses and site licenses are available upon request. See our LightningChart .NET licensing page for full details.
For more information, see our LightningChart .NET product page.
전화 : 00798 14 800 6332
팩스 : +1 770 250 6199


