


공식 공급 업체
200 이상의 소프트웨어 개발처와 판매 계약을 맺은 공인 디스트리뷰터로서 합법적인 라이선스를 제공합니다.
모든 브랜드 보기.

LogicGem is a Windows application designed to empower both business analysts and software developers by streamlining the creation and verification of complex business rules through decision table methodology. It offers a user-friendly interface to define rules, identify any missing, ambiguous, or conflicting logic, and then generate natural language documentation or programming code directly from the tables. This ensures comprehensive, consistent, and error-free rules, saving time, boosting communication clarity, and improving the overall quality of business processes and software development.
LogicGem is licensed per user and is available as a Perpetual License. See our LogicGem licensing page for full details.
For more information, visit our LogicGem product page.

Theme support in reporting controls allows you to customize the visual appearance of your reports without directly modifying individual elements. It works by applying pre-defined themes or creating custom ones, affecting aspects like fonts, colors, backgrounds, and layout. This simplifies report design, ensures brand consistency, and improves accessibility by adhering to user interface guidelines. Theme support is particularly valuable for generating multiple reports with a cohesive look and feel, catering to different audiences, or complying with specific accessibility standards.
Several WinForms reporting controls offer theme support including:
For an in-depth analysis of features and price, visit our WinForms reporting controls comparison.
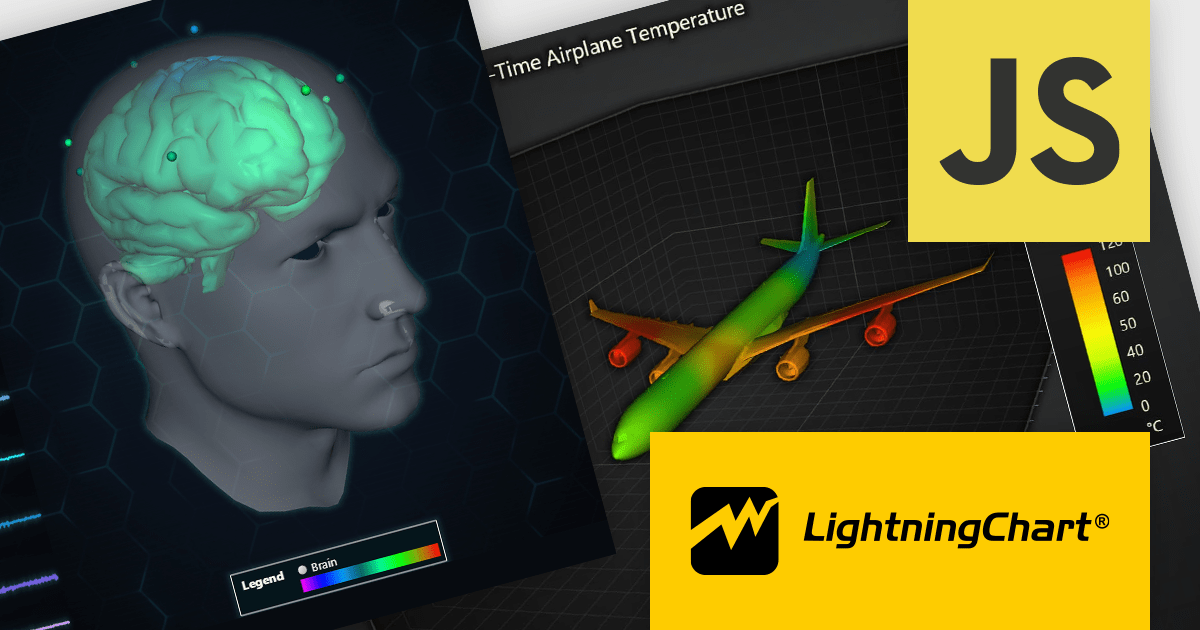
LightningChart JS is a high-performance JavaScript charting library that utilizes WebGL rendering and GPU acceleration to deliver exceptional performance for a wide range of data visualization needs. It is designed to handle large datasets and complex visualizations with ease, enabling developers to create interactive and visually appealing charts for various applications.
The LightningChart JS v5.1.0 release lets you unleash the power of complex visualizations with the new Mesh Model 3D chart type. Render intricate geometries and models with dynamic coloring pulled from a separate data set in real-time. The PaletteFill feature imbues 3D Mesh Models with vibrant colors based on vertex values, transforming your charts into captivating representations of even the most detailed 3D shapes.
To see a full list of what's new in v5.1.0, see our release notes.
LightningChart JS is licensed based on method of deployment with options including SaaS Developer Licenses, Application Developer Licenses, and Publisher Developer Licenses. Each license is perpetual and includes 1 year subscription for technical support and software updates. See our LightningChart JS licensing page for full details.
Learn more on our LightningChart JS product page.
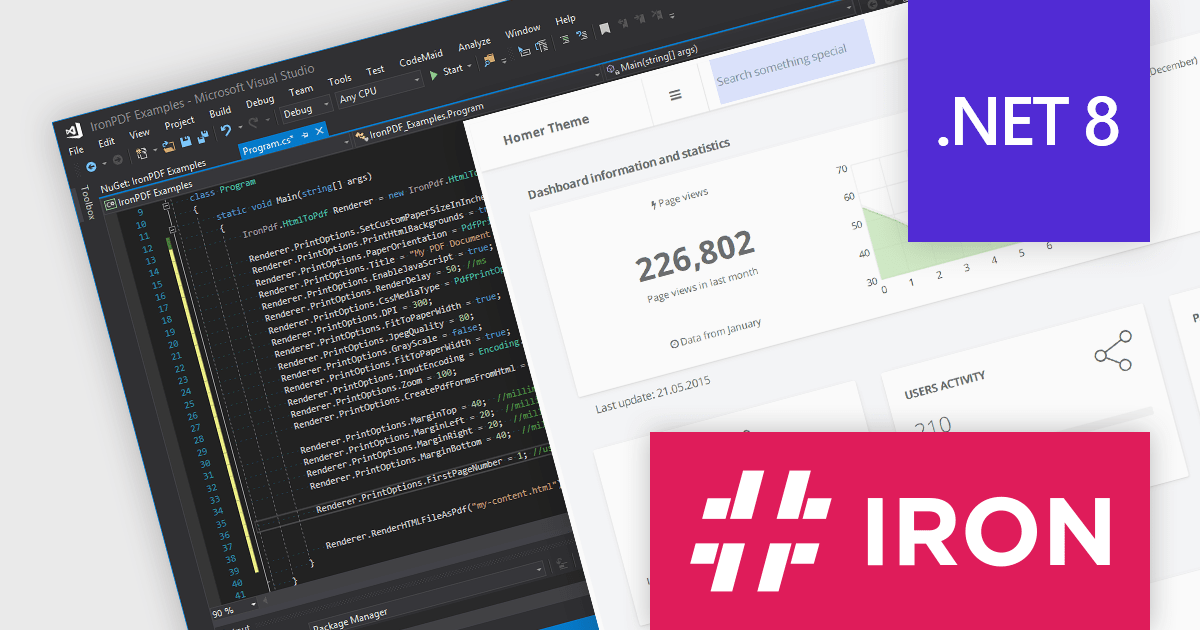
Iron Software offers a versatile suite of C# libraries specifically designed to enhance developer productivity. Its solutions empower developers to effortlessly tackle tasks like PDF manipulation, data extraction from websites and images (OCR), and seamless Excel automation, eliminating the need for external dependencies.
Iron Software products now support .NET 8, offering developers a seamless transition to the latest advancements in .NET. With this support, Iron Suite for .NET continues to be a comprehensive solution for modern application development. As an LTS release, .NET 8 offers long-term stability and security for mission-critical applications, receiving guaranteed support and patches from Microsoft until November 2026.
Iron Software products are licensed based on the number of developers, developer locations, and projects. They are available as perpetual licenses with 1 year of support and product updates. See our Iron Suite for .NET licensing page for full details.
For more information, visit our Iron Software product pages:

XML tools that support document differencing allow you to compare two or more XML files, highlighting any changes made between versions. This empowers developers by pinpointing exact modifications at a glance, including insertions, deletions and alterations to elements, attributes and text content. This helps save development time and fosters efficient code management.
Several structured document tools offer document differencing features, including:
For an in-depth analysis of features and price, visit our Structured Document Tools comparison.
전화 : 00798 14 800 6332
팩스 : +1 770 250 6199


