


공식 공급 업체
200 이상의 소프트웨어 개발처와 판매 계약을 맺은 공인 디스트리뷰터로서 합법적인 라이선스를 제공합니다.
모든 브랜드 보기.
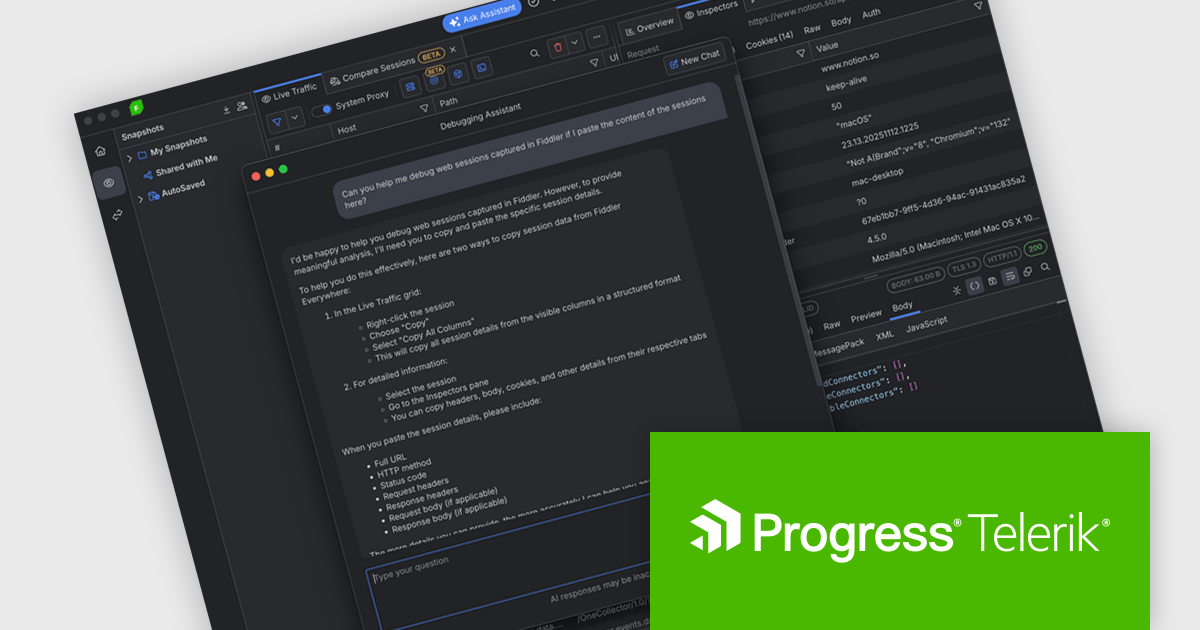
Fiddler Everywhere by Telerik is a cross-platform web debugging proxy designed to help software developers monitor, inspect, and modify HTTP and HTTPS traffic between their applications and the internet. It provides comprehensive tools for troubleshooting network-related issues, analyzing application performance, and testing web applications under different network conditions, streamlining the development and debugging process.
The Fiddler Everywhere v7.5.0 update introduces a new Debugging Assistant that helps developers debug HTTP and HTTPS traffic faster and with more confidence by delivering AI powered answers directly inside the tool. It interprets captured sessions, highlights potential issues, and provides clear explanations of anomalies so you can understand what is going wrong without manually inspecting every request and response. The assistant can also answer questions about Fiddler Everywhere features and settings, helping you discover and apply the most effective techniques for your scenario.
To see a full list of what's new in v7.5.0, see our release notes.
Fiddler Everywhere is licensed per developer and has two licensing models: an annual Subscription License and a Perpetual License. The Subscription license provides access to the latest product updates, technical support, and exclusive benefits for a flat annual fee, and must be renewed to continue using the software. The Perpetual license is a one-time purchase granting access to the current released version and includes a one-year subscription for product updates and technical support. After this initial period, users can choose to renew the subscription element to continue receiving updates and support; otherwise, they may continue using the installed version available during their active subscription term but will forgo future updates and support. See our Fiddler Everywhere licensing page for full details.
For more information, see our Fiddler Everywhere product page.
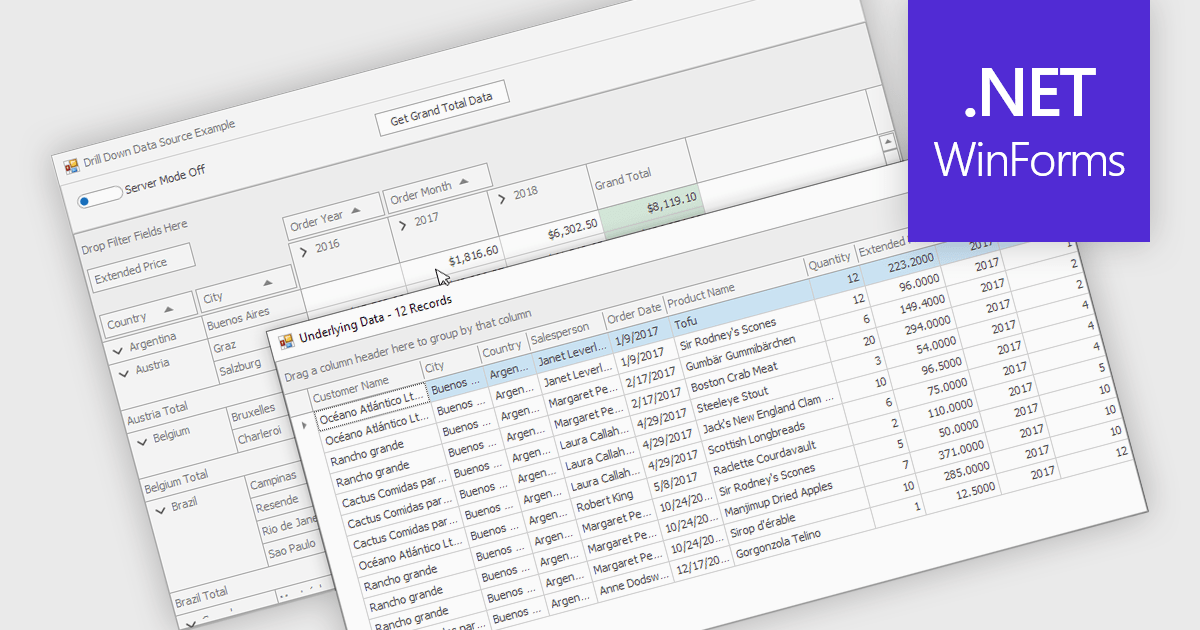
Drill-down capability within a grid control enables users to move from summary data to increasingly detailed records within the same interface, creating a smooth and focused exploration experience. It improves productivity by reducing screen changes and extra queries, helps users spot patterns and exceptions more quickly, and keeps complex information clearly organized. Typical use cases include reviewing sales by region, then by city and customer, analyzing financial summaries that open into individual transactions, or exploring product inventories from category to specific item.
Several .NET WinForms grid controls offer drill-down capability including:
For an in-depth analysis of features and price, visit our .NET WinForms grid controls comparison.
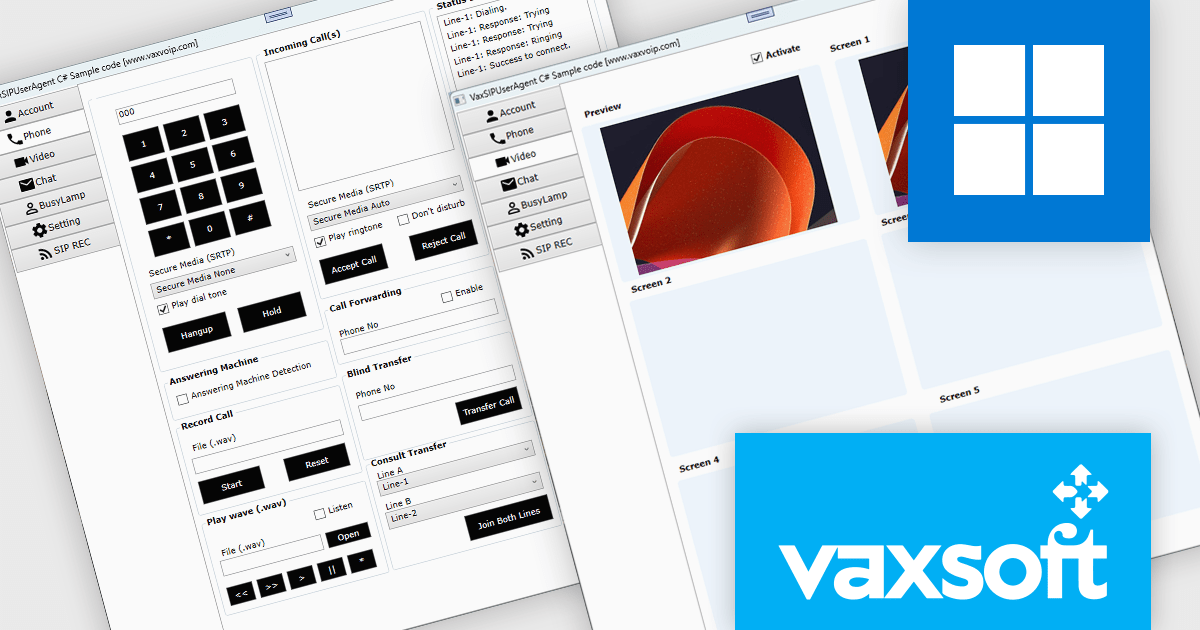
VaxVoIP MS Windows SIP Phone SDK by VaxSoft is a comprehensive software development kit designed to help developers build, customize, and distribute SIP-based VoIP softphones for Windows. It provides all the essential tools and sample code needed to create professional, feature-rich communication applications with ease. With full control over the user interface and functionality, developers can integrate SIP capabilities into their software while maintaining complete flexibility over design and branding.
From enterprise communication platforms and call center applications to custom-branded softphones for service providers, the SDK supports a wide range of use cases. Its SIP integration and developer-friendly structure enable rapid delivery of reliable communication tools that enhance collaboration and strengthen brand identity.
VaxVoIP MS Windows SIP Phone SDK is licensed under a single software brand product license, allowing use for one software application with limited distribution rights. Developers may distribute compiled applications to end users, but redistribution of the SDK or its source code is prohibited, and each license is tied to a specific service provider or client. See our VaxVoIP MS Windows SIP Phone SDK licensing page for full details.
For more information, visit our VaxVoIP MS Windows SIP Phone SDK product page.
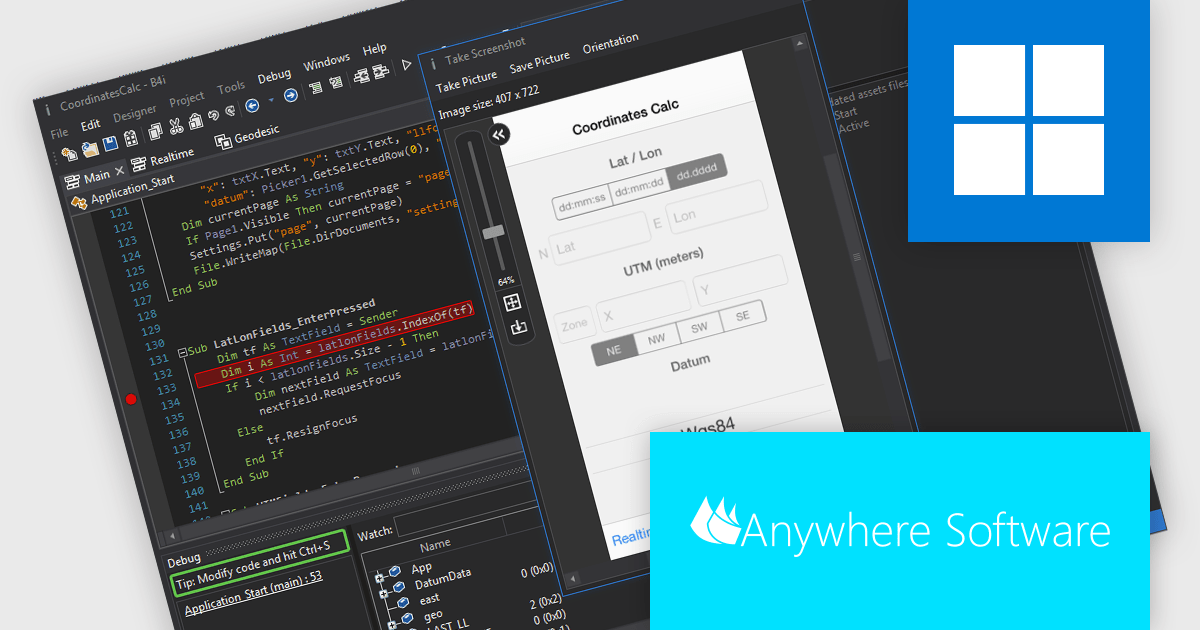
B4i (iOS), by Anywhere Software, is a Rapid Application Development (RAD) tool for building native iOS apps on Windows machines. It bypasses the need for a local Mac computer, allowing developers to create iOS apps entirely within their Windows environment if they use Anywhere Software's Hosted Mac Builder service to execute the compilation process. B4i offers a powerful solution for Windows developers wanting to tap into the iOS app market.
The B4i (iOS) v10.0 update provides developers with full support for Xcode 26 and iOS 26, ensuring compatibility with Apple’s latest toolchain, APIs, and platform requirements. This update enables more efficient development, testing, and deployment by aligning projects with current OS standards and taking advantage of recent performance, stability, and Swift language improvements. It also helps maintain long-term app reliability by reducing issues related to deprecated technologies and ensuring readiness for future updates and App Store submissions, improving overall development productivity and confidence.
To see a full list of what's new in v10.0, see our release notes.
B4i (iOS) is licensed per developer and is available as a perpetual license in either the Standard Edition (which includes two months of upgrades) or the Enterprise Edition (which includes two years of upgrades). The Hosted Mac Builder service must be renewed annually to remain active. See our B4i (iOS) licensing page for full details.
For more information, see our B4i (iOS) product page.
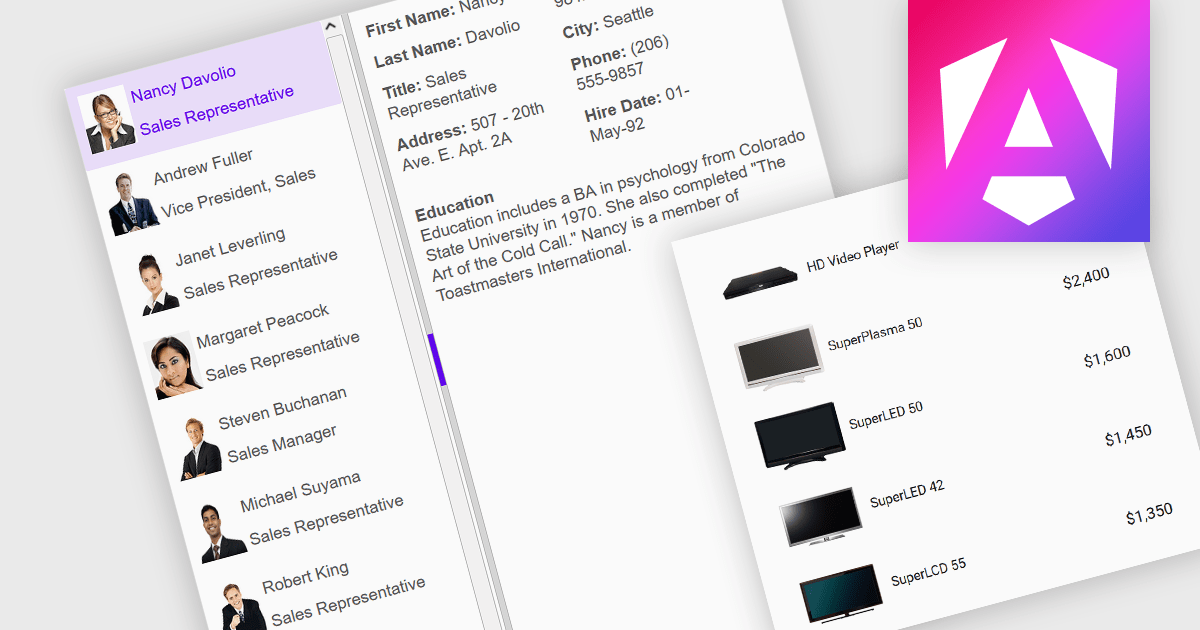
An image listbox is a type of data editor and user interface component that, like the standard listbox, presents a list of selectable items but with the ability to display images alongside or instead of the textual items. By using an associated icon, thumbnail or other graphic for improved visual recognition, this format provides a visual reference for each item, allowing users to browse and select their input more efficiently when the items are more easily identified by appearance than by label. The combination of images with text in a structured, selectable list makes the image listbox valuable in applications that involve data selection, as visually enriched items are well suited in scenarios where users must choose from items that are better identified via imagery (such as product catalogs, avatars, icons, or file previews) rather than by text alone.
Several Angular data editor collections provide image listbox support, including:
For an in-depth analysis of features and price, visit our comparison of Angular data editor components.
전화 : 00798 14 800 6332
팩스 : +1 770 250 6199


