
Froala Charts
인터랙티브 차트를 통해 웹 및 모바일 애플리케이션에 대한 반응형 보고서 및 대시보드를 만듭니다.
Froala사에서 공개
2020년 부터 ComponentSource에서 판매중
더 이상 이 제품을 제공 하지 않습니다.
인터랙티브 차트를 통해 웹 및 모바일 애플리케이션에 대한 반응형 보고서 및 대시보드를 만듭니다.
Froala사에서 공개
2020년 부터 ComponentSource에서 판매중

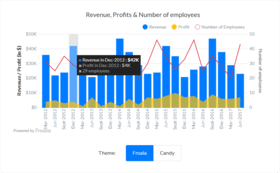
Froala Charts is a comprehensive library of JavaScript charts to create beautiful, responsive reports and interactive dashboards for web and mobile applications. Incorporating data visualization capabilities via interactive charts has been a growing need for enterprise app developers that are also using Froala Editor. Froala Charts bridges the gap. Draw quick insights from your data using the wide variety of visualizations from basic charts, widgets, to domain-specific charts and more. Choose from basic column charts, line charts, pie charts, combo charts, to powerful widgets such as gauges, KPIs, funnels, or advanced domain-specific charts such as timeseries, radar, chord, sankey, heat maps and more.


이미지 1/8
Froala Charts for your data visualization needs:
Froala 사 제품 라이선스 담당자와 라이브 채팅


전화 : 00798 14 800 6332
팩스 : +1 770 250 6199


