Infragistics NetAdvantage for Silverlight
Silverlight의 정교한 기능을 활용하는 풍부한 고급 데이터 시각화를 추가.
Infragistics사에서 공개
1996년 부터 ComponentSource에서 판매중
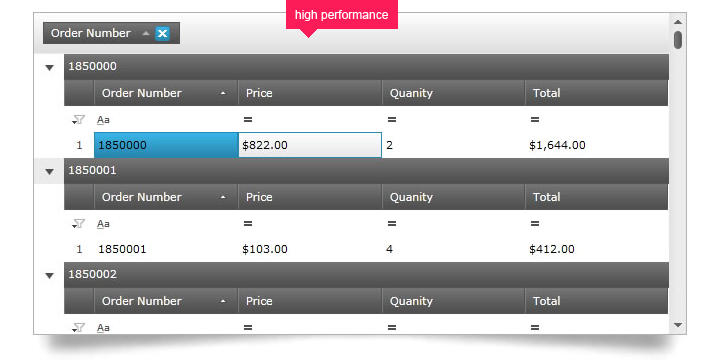
An editable, hierarchical data grid control designed for high performance and hundreds of thousands of rows. Pivot grid functionality lets users slice, dice and filter the multidimensional data of your OLAP cube or data warehouse, putting the full power of online analytical processing within your Silverlight applications.


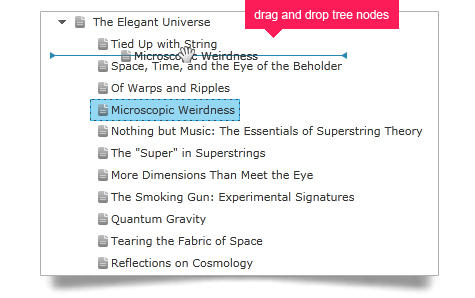
This databound tree is built for speed even while it comfortably handles tens of thousands of tree nodes to any depth and with multiple kinds of child nodes through its flexible node templates.


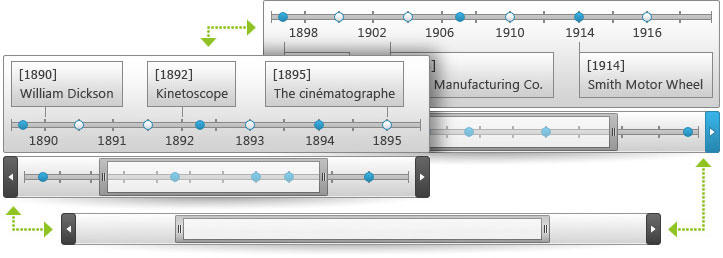
Empower users to quickly understand and visualize sequences of events in Silverlight which could be the steps in a narrative for a business process or workflow, important project milestones, key frames in a video, a transaction history on an account, or any similar timeline.


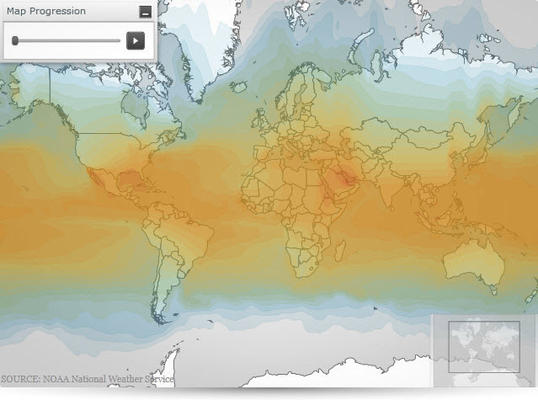
Create highly detailed, thematic geographical maps using an innovative feature set that includes custom shape templates, the ability to render polylines and polyshapes, Map Progression, Scatter Area Plots, an intuitive Overview Pane and much more.

