
LightningChart Python
데이터 사이언스 및 소프트웨어 개발 Python 앱을 위한 고성능 GPU 가속 2D 및 3D 데이터 시각화 라이브러리입니다.
LightningChart사에서 공개
2021년 부터 ComponentSource에서 판매중
데이터 사이언스 및 소프트웨어 개발 Python 앱을 위한 고성능 GPU 가속 2D 및 3D 데이터 시각화 라이브러리입니다.
LightningChart사에서 공개
2021년 부터 ComponentSource에서 판매중

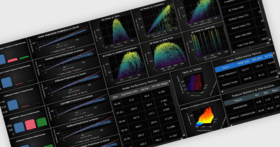
LightningChart Python is a high performing data visualization library for the Python programming language. It allows you to present real-time or static data as fast and interactive 2D or 3D charts. Designed for data scientists and software developers, this GPU-accelerated charting library can handle large static datasets or dynamic real-time streaming data by utilizing graphics processors and WebGL rendering for the smooth visualization of up to millions of data points.


이미지 1/8
LightningChart Python Features
LightningChart 사 제품 라이선스 담당자와 라이브 채팅


전화 : 00798 14 800 6332
팩스 : +1 770 250 6199


