컴포넌트 / Vizuly / Embarcadero
Create highly customized and unique data visualizations.
Corona Chart - This radial chart provides angular and curved radial area line curves and supports both an overlap and stacked layout. It also features over a dozen different dynamic styles and comes bundled with an easy to use test container that demonstrates seven uniquely styled themes.
-
설명:
A collection of VCL and FMX tools and components for Delphi and C++Builder. RAD Solution Pack features charting, reporting, grids, UI controls, debugging, analytics and IoT components and tools in a single cost effective solution. It includes Steema ...
더 읽기
-
설명:
Premier VCL UI Control Suite for Windows. Konopka Signature VCL Controls is a suite of over 200 Windows UI controls designed to make your applications more intuitive and visually stunning, Delphi and C++Builder developers can modernize and simplify every ...
더 읽기
-
설명:
Live local and remote application logging. CodeSite for RAD integrates with RAD Studio providing deeper insight into code execution with a live viewer logging system that helps locate problems quickly while code is executing locally or remotely. Go beyond ...
더 읽기
-
설명:
Live local and remote application logging. CodeSite for.NET integrates with Visual Studio providing deeper insight into code execution with a live viewer logging system that helps locate problems quickly while code is executing locally or remotely. Go ...
더 읽기
-
설명:
Add charts and visualizations to your JavaScript apps. Vizuly Professional includes Corona, Halo, Radial Bar, Ring Chart, Weighted Tree, Geo Plot, Bar Chart, Column Chart, Line Area Chart, Radar Chart, Radial Progress, Scatter Plot, Sunburst, Tree Map, ...
더 읽기
-
설명:
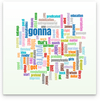
Add Word Clouds to your JavaScript apps. Vizuly Word Cloud is a unique way to represent the occurrence rate of words within a given text stream. This visualization supports an exclusion list that will ignore common pronouns, profanity, or any words you ...
더 읽기
-
설명:
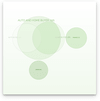
Add Venn Diagram charts to your JavaScript apps. Vizuly Venn Diagram shows all possible logical relations between a finite collection of different sets. This chart depicts elements as points in the plane, and sets as regions inside closed curves. A Venn ...
더 읽기
-
설명:
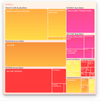
Add Tree Map charts to your JavaScript apps. Vizuly Tree Map visualizes hierarchical data in nested rectangular plots where the area of each rectangle is bound to a data property you can set. This TreeMap also supports the ability to drill down/up, in ...
더 읽기
-
설명:
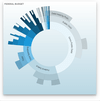
Adds Sunburst charts to your JavaScript apps. Vizuly Sunburst is designed to represent hierarchical data in a radial plot. It supports drill down and drill up capabilities by allowing the user to collapse and expand segments of the sunburst when they ...
더 읽기
-
설명:
Add Scatter Plot charts to your JavaScript apps. Vizuly Scatter Plot shows 3 dimensions of data at once by plotting values along both the x and y axis as well as the radius of the plot itself. Each plot can be colored and styled dynamically based on your ...
더 읽기


