
Vizuly Scatter Plot
JavaScript 앱에 Scatter Plot 차트를 추가 합니다.
Vizuly Professional includes all Vizuly components at a significant discount.
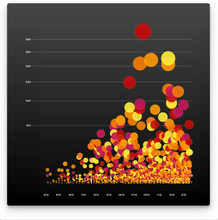
Vizuly Scatter Plot shows 3 dimensions of data at once by plotting values along both the x and y axis as well as the radius of the plot itself. Each plot can be colored and styled dynamically based on your data.


이미지 1/5
Features
Framework Adapters
전화 : 00798 14 800 6332
팩스 : +1 770 250 6199


