


Fornecedor oficial
Como distribuidores oficiais e autorizados, nós fornecemos licenças legítimas diretamente de mais de 200 editores de software.
Ver todas as nossas marcas.
GroupDocs.Metadata for Node.js via Java bridges the gap between Node.js applications and the powerful Java library, GroupDocs.Metadata. This integration empowers developers to seamlessly manage document metadata within their Node.js projects. It enables CRUD (Create, Read, Update, Delete) operations on a vast array of file formats, including popular document, image, and archive types.
This solution unlocks numerous benefits for developers. It grants Node.js applications the ability to leverage GroupDocs.Metadata's robust features, such as searching and updating specific metadata properties, handling password-protected documents, and extracting technical details from various file types. It also streamlines development by providing a familiar Node.js interface for a powerful Java library, simplifying the integration of metadata management functionalities into existing projects.
GroupDocs.Metadata for Node.js via Java is offered as Developer Small Business, Developer OEM, Site Small Business, and Site OEM licenses catering to a range of business needs. Licenses are perpetual, and include 1 year of support and maintenance. Subscription renewals are also available. See our GroupDocs.Metadata for Node.js via Java licensing page for full details.
GroupDocs.Metadata for Node.js via Java is available in the following products:
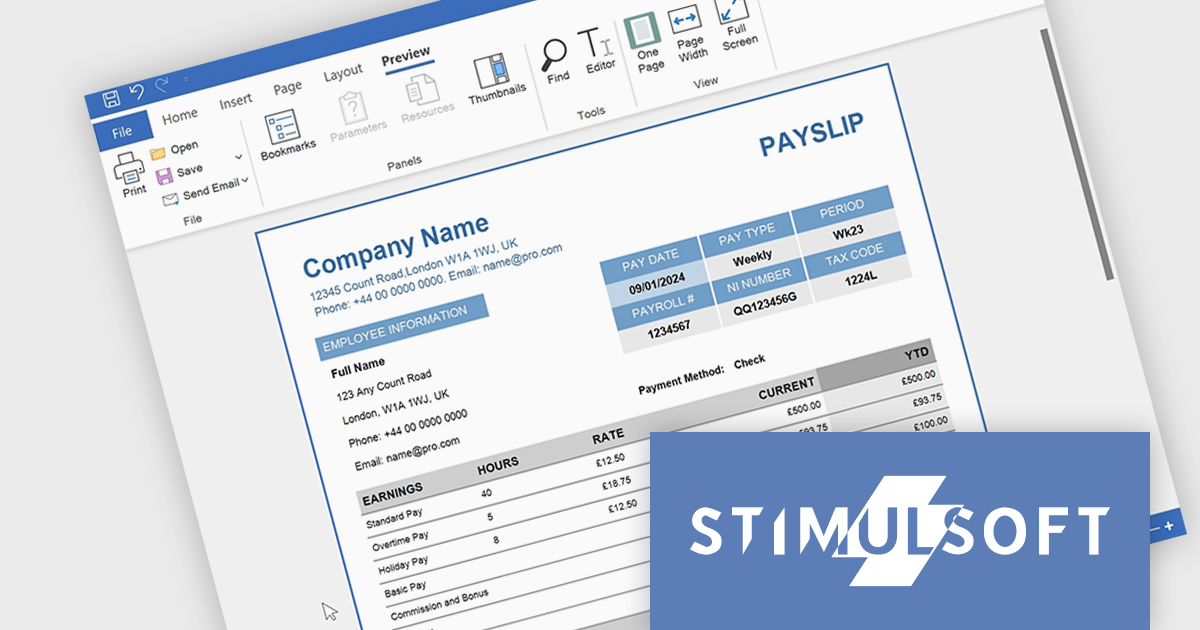
Stimulsoft Reports.PYTHON offers a robust reporting solution for Python developers. It integrates seamlessly into various development environments and boasts cross-platform compatibility. This empowers you to design visually stunning reports featuring charts, gauges, and other interactive elements. By leveraging Stimulsoft Reports, you can efficiently generate informative summaries of your Python application's data, enhancing decision-making capabilities.
Stimulsoft Reports.PYTHON offers a number of benefits for developers. Its versatile data source connectivity allows for effortless report generation from various sources. Additionally, the client-server architecture ensures efficient report processing and a smooth user experience. This makes Stimulsoft Reports.PYTHON an ideal solution for creating informative reports across diverse use cases, from generating financial statements and sales invoices to compiling customer data and project summaries.
Stimulsoft Reports.PYTHON is licensed per developer and is available as a Perpetual license with 1 year support and maintenance. See our Stimulsoft Reports.PYTHON licensing page for full details.
Stimulsoft Reports.PYTHON is available in the following products:

Trackbar controls, also known as sliders, are user interface (UI) elements that allow users to adjust a numerical value within a defined range by moving a slider along a bar. These controls are highly valuable for settings that require a visual representation of adjustment, such as volume, brightness, or other application-specific parameters. Trackbars enhance the user experience by providing a simple and effective method to input values, which can be particularly useful for fine-tuning settings without the need for direct numerical input. Their intuitive design promotes ease of use and quick interaction, making them an excellent choice for graphical user interfaces where space is limited and precision is necessary.
Several React components offer Trackbar Data Editors including:
For an in-depth analysis of features and price, visit our comparison of React Data Editors.
GroupDocs.Merger for Node.js via Java empowers developers to seamlessly integrate document merging and splitting capabilities into their Node.js applications. It enables Node.js applications to leverage the robust document processing features of the GroupDocs.Merger Java library, eliminating the need for developers to rewrite merging, saving development time and resources.
This library offers a powerful solution for enhancing document management in Node.js applications. Users can benefit from its broad format support for effortless integration and merging of diverse document types including Word, Excel, PowerPoint, Visio, PDF, OpenDocument, image, and archive formats. It empowers developers to split large documents, reorder or replace pages, manage document protection, and even render documents as images. These functionalities streamline document organization, improve collaboration processes, and provide greater flexibility in handling various document needs within Node.js applications.
GroupDocs.Merger for Node.js via Java is offered as Developer Small Business, Developer OEM, Site Small Business, and Site OEM licenses catering to a range of business needs. Licenses are perpetual, and include 1 year of support and maintenance. Subscription renewals are also available. See our GroupDocs.Merger for Node.js via Java licensing page for full details.
GroupDocs.Merger for Node.js via Java is available in the following products:
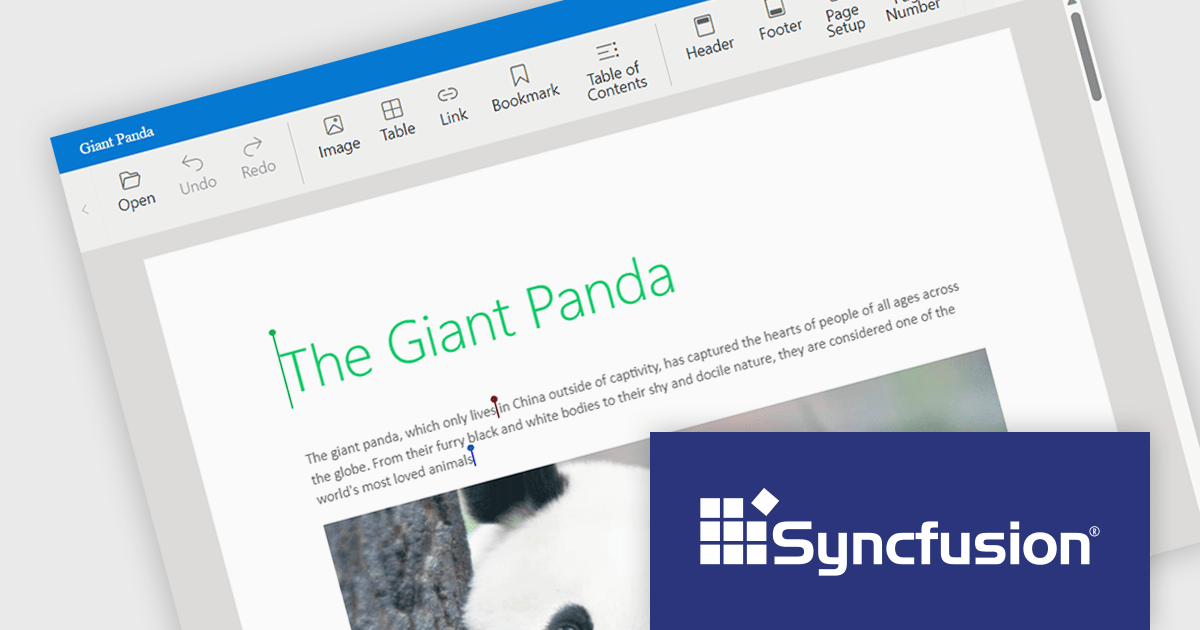
Syncfusion Essential Studio JavaScript, available as part of Syncfusion Essential Studio Enterprise, is a comprehensive UI library offering over 80 high-performance, lightweight, and responsive components to transform your web apps. Built from scratch with TypeScript, it boasts modularity and touch-friendliness, letting you pick and choose specific features while ensuring smooth mobile interaction. With rich themes, global accessibility features, and extensive documentation, it powers everything from basic buttons to interactive charts and data grids, simplifying front-end development across JavaScript, Angular, React, and Vue.
Syncfusion Essential Studio JavaScript 2024 Volume 1 (25.1.35) introduces real-time collaborative editing for the Word Processor component. This enables multiple users to co-author documents simultaneously, with changes visible to all participants as they happen. Collaborative editing streamlines the document workflow and fosters improved teamwork.
To see a full list of what's new in version 2024 Volume 1 (25.1.35), see our release notes.
Syncfusion Essential Studio JavaScript is available as part of Syncfusion Essential Studio Enterprise which is licensed per developer starting with a Team License of up to five developers. It is available as a 12 Month Timed Subscription License which includes support and maintenance. See our Syncfusion Essential Studio Enterprise licensing page for full details.
For more information, visit our Syncfusion Essential Studio JavaScript product page.
Tel: (888) 850 9911
Fax: +1 770 250 6199


