


Fornecedor oficial
Como distribuidores oficiais e autorizados, nós fornecemos licenças legítimas diretamente de mais de 200 editores de software.
Ver todas as nossas marcas.
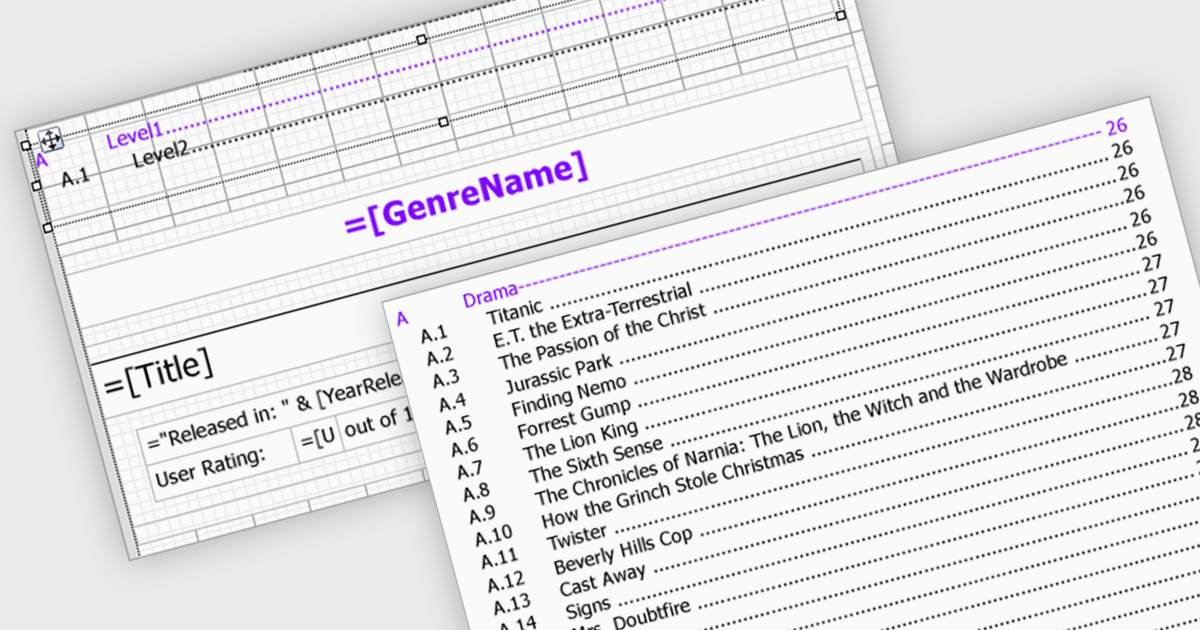
Reporting components streamline document creation by offering automatic Table of Contents (TOC) generation. This feature scans a document for designated headings, like titles and subtitles, and builds a clickable index at the beginning. This not only enhances professionalism but also improves user experience by allowing for easy navigation within lengthy reports. Automatic TOC generation proves particularly valuable for complex documents, research papers, and technical manuals, where readers might need to quickly jump to specific sections.
Several WinForms reporting components support Table of Contents (TOC) features, including:
For an in-depth analysis of features and price, visit our comparison of WinForms reporting components.

Conditional formatting in a spreadsheet component allows you to dynamically alter the visual appearance of cells based on predefined rules. This functionality enhances data readability by highlighting specific values or trends within your spreadsheet. By visually differentiating critical information, conditional formatting empowers developers to create more user-friendly and informative data presentations within their ASP.NET applications.
Several ASP.NET Core Assembly Spreadsheet Controls offer Conditional Formatting including:
For an in-depth analysis of features and price, visit our comparison of ASP.NET Core Assembly Spreadsheet Controls.
LightningChart .NET is a high-performance data visualization library designed for .NET developers working with WPF, WinForms, and UWP applications. It offers GPU-accelerated rendering for smooth real-time visualization of massive datasets, exceeding billions of data points. This library supports a wide variety of chart types, including 2D, 3D, polar, and geographic maps, along with extensive customization options for each. LightningChart .NET is a powerful tool for developers creating demanding data visualization applications requiring exceptional performance.
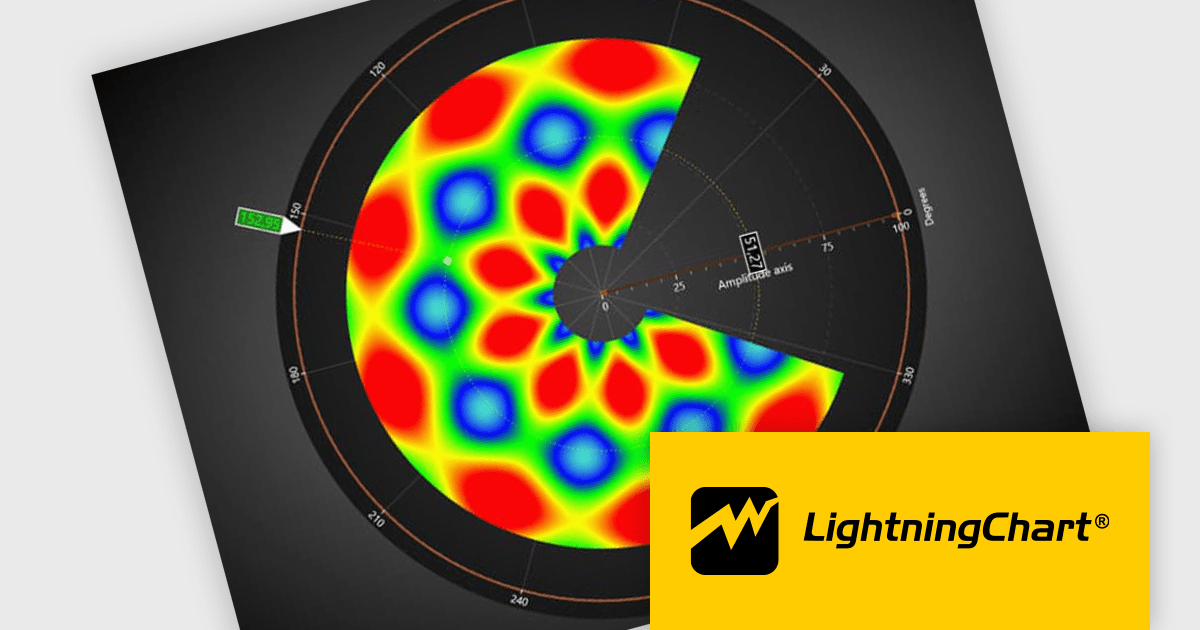
The LightningChart v12 update introduces the Polar Heatmap / IntensityGrid series (IntensityGridSeriesPolar), specifically designed for visualizing complex polar data with intensity values. Polar Heatmap charts utilizes a circular coordinate system to visualize data. One axis represents angles (thetas) while the other, known as amplitude, represents the distance from a central point (radii). Color intensity encodes the data values, effectively creating a circular heatmap that reveals both directional trends (angles) and variations in magnitude (amplitude) within the data. This chart type excels at analyzing cyclical or angular data, making it ideal for applications like wind speed and direction or seasonal variations throughout the year.
To see a full list of what's new in v12.0, see our release notes.
LightningChart .NET is available per developer in packages for either WPF, WinForms, UWP or all 3. Each package comes as a subscription license (with 1 or 2 years of limited support), or a perpetual license (with 1 or 2 years of Standard or Premium support). Floating licenses and site licenses are available upon request. See our LightningChart .NET licensing page for full details.
Learn more on our LightningChart .NET product page.
DevExpress WPF is a powerful suite of controls that enhances your WPF development toolkit. It offers data grids, ribbon menus, rich text editors, spreadsheets, charts, and more – all with beautiful themes and touch-friendly interfaces. DevExpress WPF empowers you to build professional-looking, responsive applications that meet modern user expectations, saving you time and effort while adding polish and functionality.
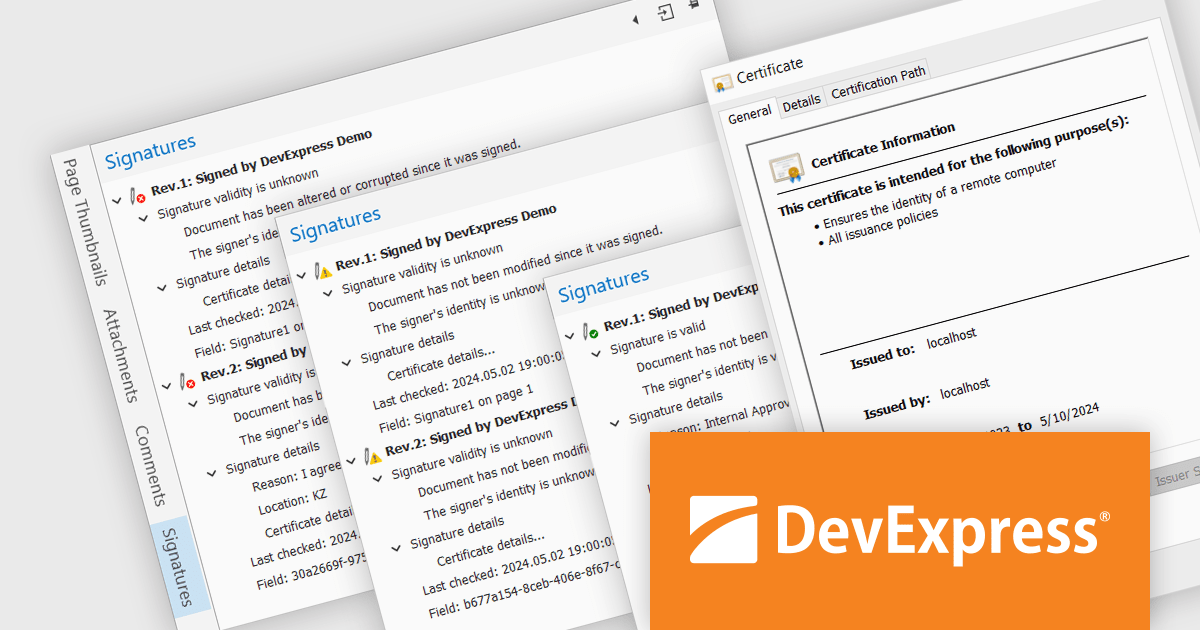
The DevExpress WPF 24.1 update includes a new Signature Info Panel in the PDF Viewer. This feature offers a transparent view of every signature within a PDF, providing detailed information about each signer. The Signature Info Panel goes a step further by intelligently verifying the validity of these signatures in real-time. This instant feedback ensures users can confidently rely on the information presented in the document, saving time and effort.
To see a full list of what's new in version 24.1, see our release notes.
DevExpress WPF is licensed per developer and is available as a Perpetual License with a 12 month support and maintenance subscription. We can supply new subscriptions, subscription renewals, and additional licenses. See our DevExpress WPF licensing page for full details.
DevExpress WPF is available to buy in the following products:
NOV Diagram for .NET by Nevron is a comprehensive and feature-rich diagramming framework designed for .NET developers to create specialized diagramming and drawing applications. Including most of the functionality found in Microsoft Visio, it offers an array of features such as high-performance rendering, a rich set of predefined shapes, automatic layout algorithms, and extensive input/output capabilities. This tool facilitates the integration of complex visualizations directly into WinForms, WPF, Blazor, and Xamarin.Mac projects for developing sophisticated diagramming solutions while maintaining responsiveness and user interactivity.
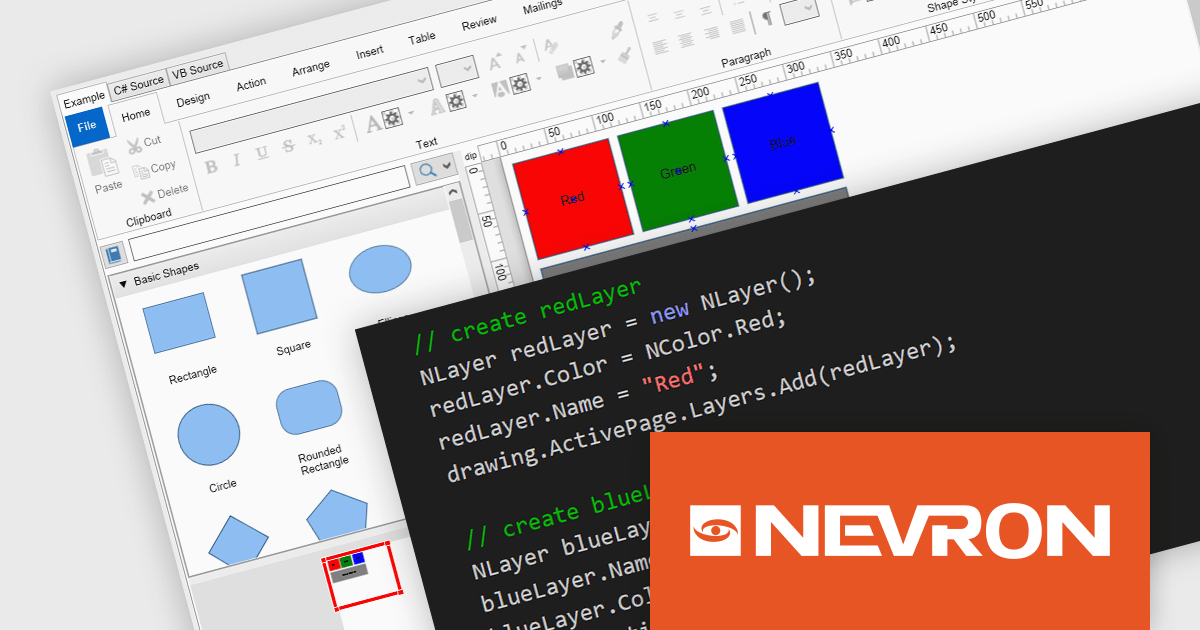
The NOV Diagram for .NET 2024.1 update introduces a new layers feature which gives developers greater control over complex diagram designs. Enabling the segregation of different visual components into distinct layers allows for better organization, making it easier to manage intricate diagrams that require multiple overlapping elements. This functionality means that each page item can now be assigned to a layer, which can be independently manipulated, hidden, or locked without affecting others. This provides a more streamlined workflow and reduces the likelihood of errors during both development and runtime.
To see a full list of what's new in 2024.1, see our release notes.
NOV Diagram for .NET is licensed per developer and is available as a perpetual license with 1 year support and maintenance. See our NOV Diagram for .NET licensing page for full details.
NOV Diagram for .NET is available in the following products:
Tel: (888) 850 9911
Fax: +1 770 250 6199


