


Fornecedor oficial
Como distribuidores oficiais e autorizados, nós fornecemos licenças legítimas diretamente de mais de 200 editores de software.
Ver todas as nossas marcas.
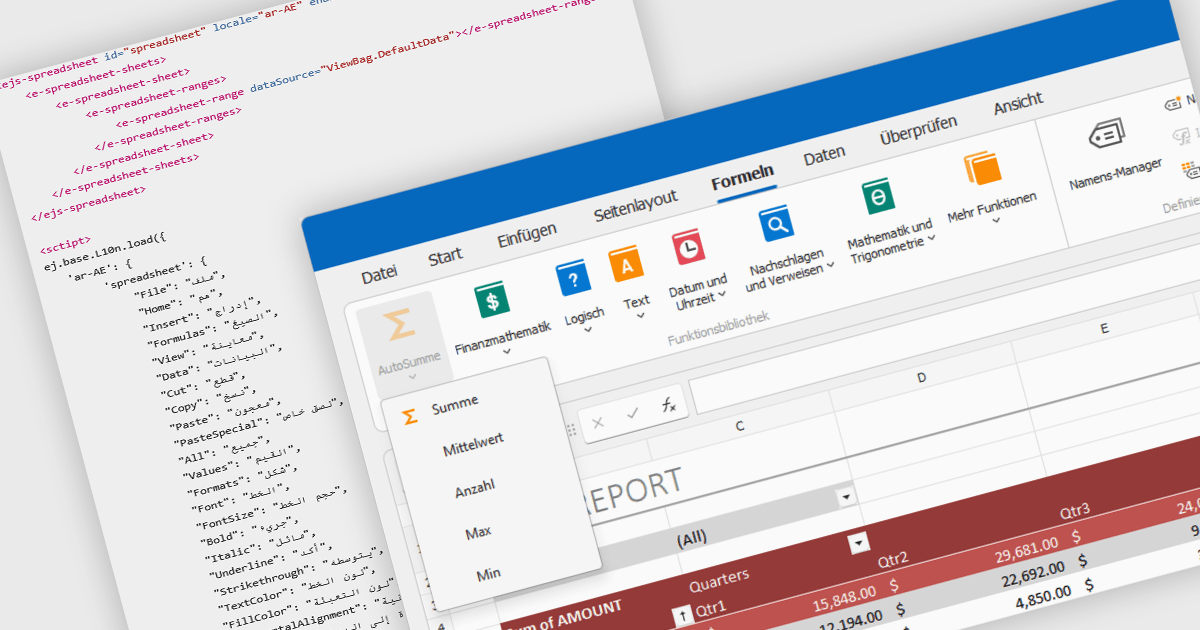
Localization in spreadsheet components enables applications to present spreadsheet interfaces, menus, dialogs, functions, and user-facing messages in the user's preferred language and regional format. This helps organizations deliver a more familiar and accessible experience to global audiences while supporting regional conventions such as date formats, number formatting, currencies, and translated interface elements. By adapting the spreadsheet environment to different languages and cultures, localization can improve usability, reduce training requirements, and help applications meet the expectations of international users.
Several ASP.NET Core spreadsheet controls offer support for localization including:
For an in-depth analysis of features and price, visit our ASP.NET Core spreadsheet controls comparison.
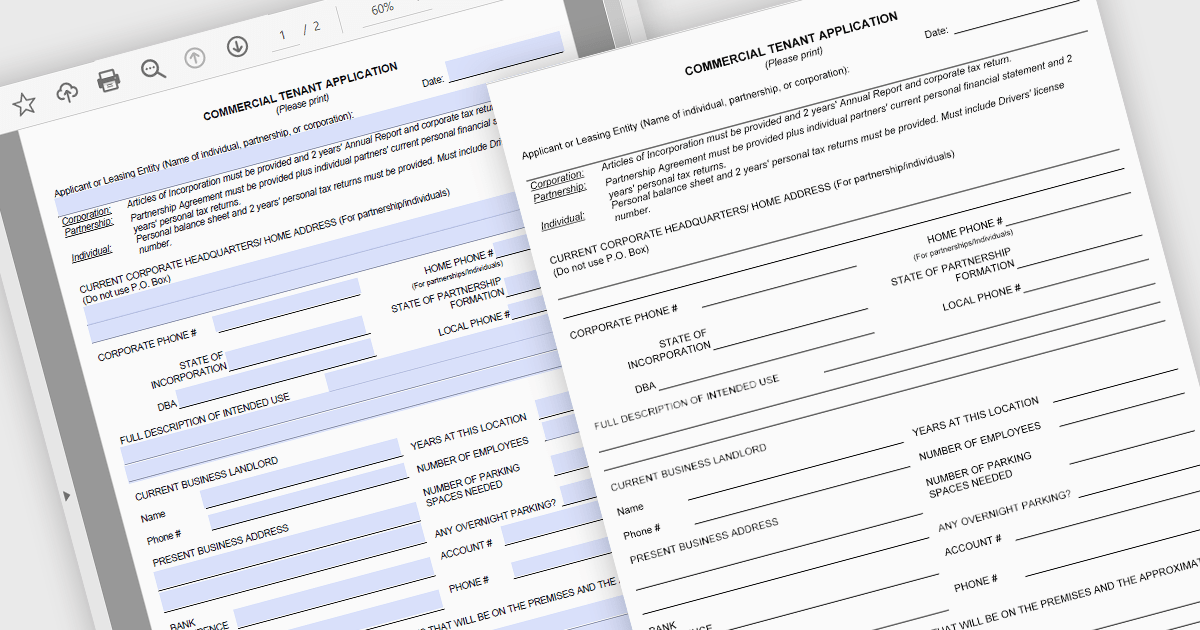
Converting PDFs to SVG in PDF Viewers enables content to be rendered as scalable vector graphics, keeping text, diagrams, and illustrations sharp at any zoom level. This improves viewing quality, responsiveness, and browser performance while ensuring documents remain crisp across all devices and high resolution displays. Common use cases include web based PDF viewers, technical documentation, engineering drawings, and applications that support annotations and interactive document experiences.
Several .NET PDF Viewer components allow you to convert PDFs to SVG's, including:
For an in-depth analysis of features and price, visit our comparison of .NET PDF Viewer components.
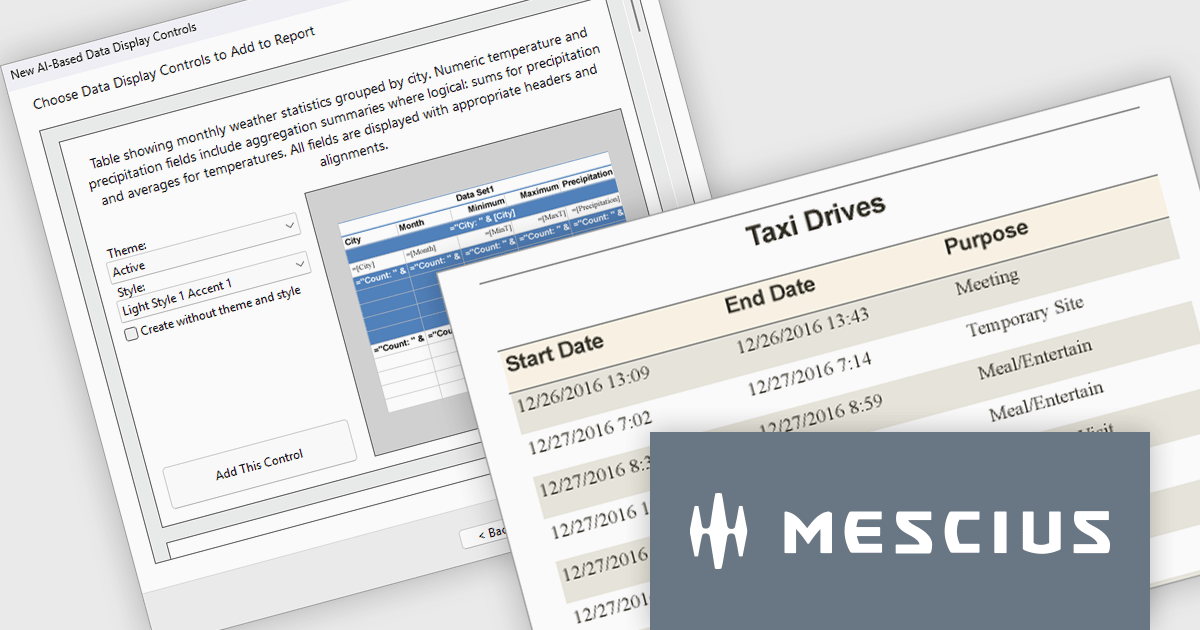
ActiveReports.NET by MESCIUS is a reporting solution for the Microsoft .NET platform that enables developers to create and deliver data-driven reports in web, desktop, and cloud applications. It supports multiple report types, including section, page, and RDL (Report Definition Language) reports, and provides visual designers, a robust rendering engine, and export options such as PDF and Excel. Designed to integrate with modern .NET and ASP.NET Core applications, it helps teams build interactive, enterprise-grade reporting features into their software.
The ActiveReports.NET v20.1 update includes AI Driven Smart Data Regions, enabling developers to generate cleaner and more consistent report layouts automatically. By applying standardized date formatting, removing duplicate columns, and using structured grouped table layouts with appropriate headers, footers, and page breaks, it reduces the need for manual report refinement while improving readability and navigation. This enhancement helps development teams deliver professional quality reports more efficiently and ensures more consistent results from AI generated report designs.
To see a full list of what's new in v20.1, see our release notes.
ActiveReports.NET is licensed per developer. Dependent on geographic location it is available as either an Annual (Timed) Subscription License or as a Perpetual Developer License which comes with 1 year of software updates and support. Each developer requires a license to design, develop, or maintain applications. The Annual Subscription License must be renewed each year to continue to work with the software. Published applications are royalty free and do not expire. Optional pipeline licenses available for CI/CD build servers. See our ActiveReports.NET licensing page for full details.
Learn more on our ActiveReports.NET product page.
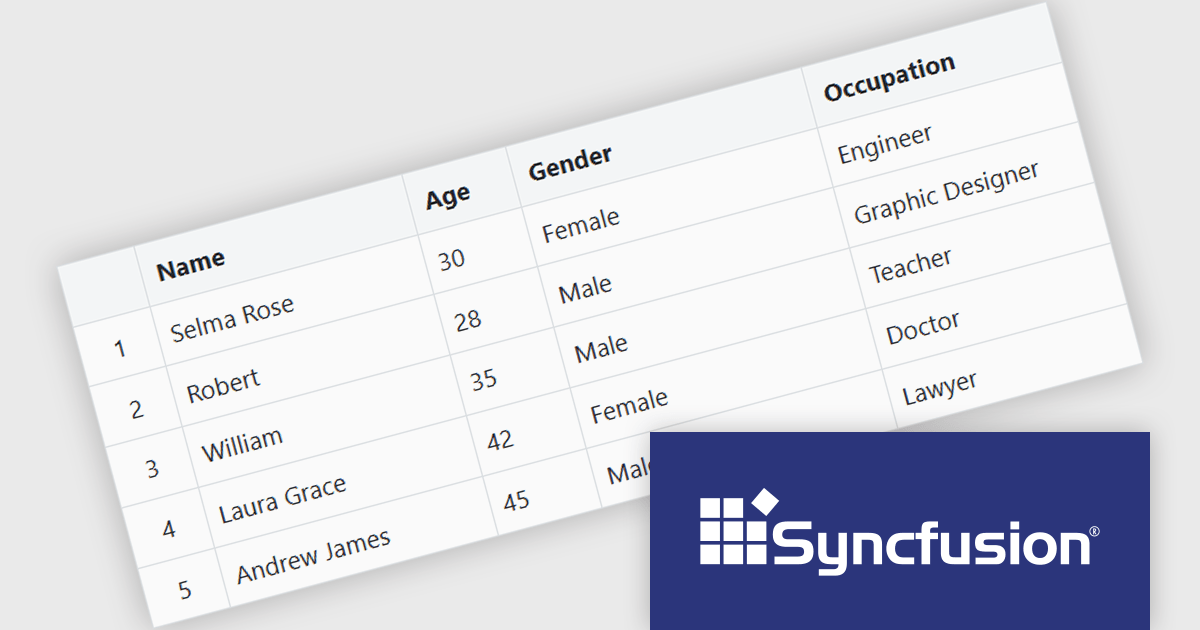
Syncfusion Essential Studio Enterprise provides a comprehensive collection of UI components and frameworks for building modern cross-platform applications. It offers over 1,800 components compatible with .NET WinForms, WPF, ASP.NET Core & MVC, WinUI, MAUI, JavaScript, Blazor, and more, enabling seamless application development across diverse devices and operating systems.
Syncfusion Essential Studio Enterprise has added a new ASP.NET Core Block Editor control bringing a flexible content-authoring experience to web applications, allowing users to create and organize rich content through intuitive, block-based editing. By supporting structured content elements such as text, images, lists, and other reusable blocks, the control simplifies the creation of dynamic pages while improving content consistency and maintainability. For developers, the Block Editor offers an efficient way to incorporate modern content management capabilities into ASP.NET Core applications, reducing the need for custom development and helping deliver engaging editing experiences with less effort.
Syncfusion Essential Studio Enterprise is licensed per developer and is available as a 12 Month Timed Subscription License which includes support and maintenance. See our Syncfusion Essential Studio Enterprise licensing page for full details.
Learn more on our Syncfusion Essential Studio Enterprise product page.
Actipro WPF Studio is a complete suite of WPF UI controls and components for building modern Windows desktop applications, including charts, docking, syntax editing, grids, navigation, gauges, editors, and Microsoft Office style interfaces. Designed to simplify complex application development, it helps developers create professional, feature rich business applications, developer tools, and data driven solutions faster while improving usability and user experience.
Actipro WPF Studio improves WPF application development by providing a comprehensive set of integrated UI controls and components that help developers build professional desktop applications faster and with less custom code. Its included features such as advanced docking, syntax editing, charts, grids, editors, navigation controls, and Microsoft Office style interfaces simplify the creation of complex user experiences while maintaining consistency, performance, and usability across applications. Designed for enterprise software, business tools, and data driven applications, it enables developers to deliver modern, feature rich interfaces more efficiently while reducing development and maintenance effort.
Actipro WPF Studio is licensed per developer and is available as a Perpetual license with 1 year support and maintenance. See our Actipro WPF Studio licensing page for full details.
For more information, see our Actipro WPF Studio product page.
Tel: (888) 850 9911
Fax: +1 770 250 6199


