


Fornecedor oficial
Como distribuidores oficiais e autorizados, nós fornecemos licenças legítimas diretamente de mais de 200 editores de software.
Ver todas as nossas marcas.
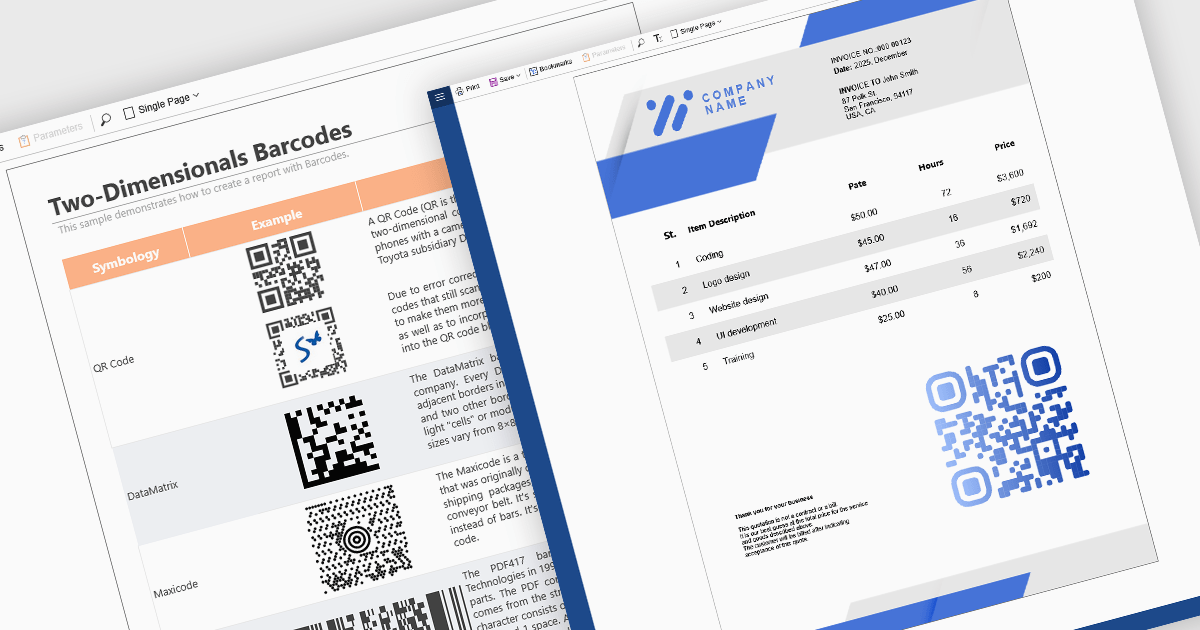
Barcode support in reporting components enables developers to embed machine-readable codes (barcodes, QR codes, DataMatrix, etc.) directly into reports. This feature is especially useful when printed or digital reports need to integrate with scanning systems, for example, in inventory management, shipping labels, product catalogs, or document tracking. By using a barcode component within a report template, reports can dynamically encode data fields (such as item IDs, order numbers, or URLs), ensuring that each generated report contains a barcode that corresponds to its data. This promotes automation, reduces manual errors, and improves interoperability with external scanning or inventory systems.
Several React reporting controls offer barcode support including:
For an in-depth analysis of features and price, visit our React reporting controls comparison.
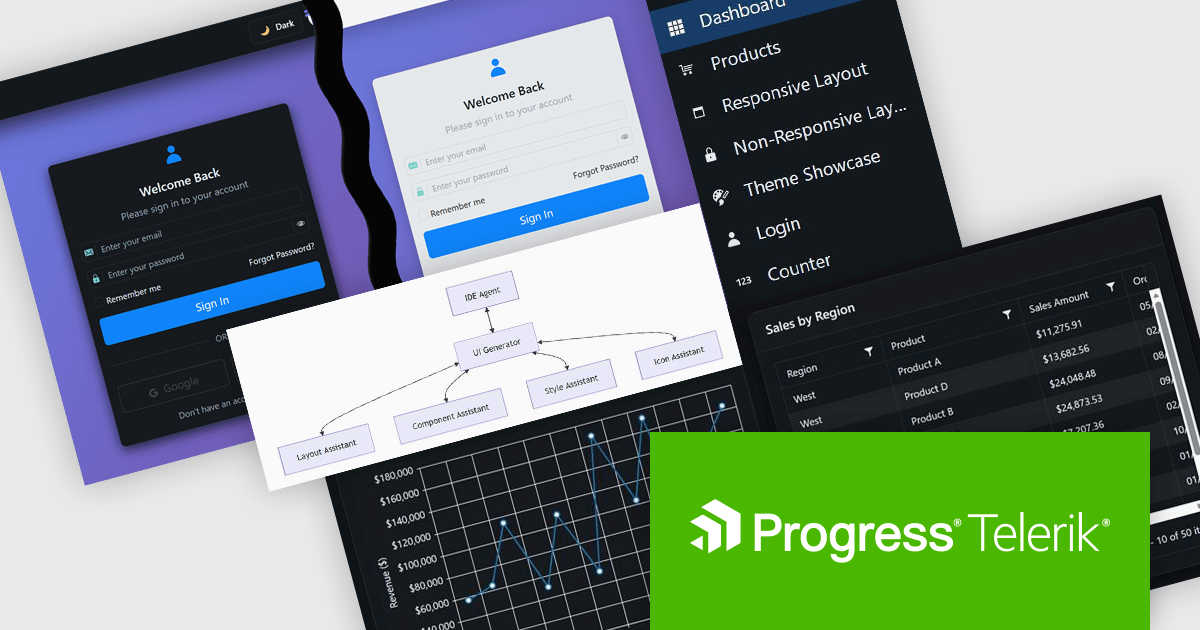
DevCraft by Telerik is a comprehensive AI-powered suite of more than 1,250 UI components and development tools designed for building modern web, desktop, and mobile applications using .NET and JavaScript frameworks. It includes reporting and report management solutions, automated testing and mocking tools, and document processing libraries, as well as a wide range of professionally designed user interface controls from the Telerik and Kendo UI suites. DevCraft enables developers to create feature-rich, high-performance applications with consistent design and user experience, delivering enterprise-level, scalable, and maintainable software solutions.
The Telerik DevCraft 2025 Q4 update adds the Agentic UI Generator which enables developers to translate natural language prompts directly into fully‑scaffolded, production‑ready user interfaces built on the Telerik and Kendo UI component libraries. It includes all the functionality of the AI Coding Assistant, as well as handling layouts, styling, responsive behavior, accessibility best‑practices, data‑bindings and theming from an MCP server that works in any AI-enabled IDE, so developers can remain in their familiar IDE and focus their effort on domain logic rather than boilerplate. This feature is only available as part of DevCraft Complete and DevCraft Ultimate subscription licenses and currently supports Blazor, Angular and React.
To see a full list of what's new in DevCraft 2025 Q4, see our release notes.
Telerik DevCraft is licensed per developer and has two licensing models: an annual Subscription License and a Perpetual License. The Subscription license provides access to the latest product updates, technical support, and exclusive benefits for a flat annual fee, and must be renewed to continue using the software. The Perpetual license is a one-time purchase granting access to the current released version and includes a one-year subscription for product updates and technical support. After this initial period, users can choose to renew the subscription element to continue receiving updates and support; otherwise, they may continue using the installed version available during their active subscription term but will forgo future updates and support. See our Telerik DevCraft Ultimate licensing page for full details.
For more information, see our product pages:
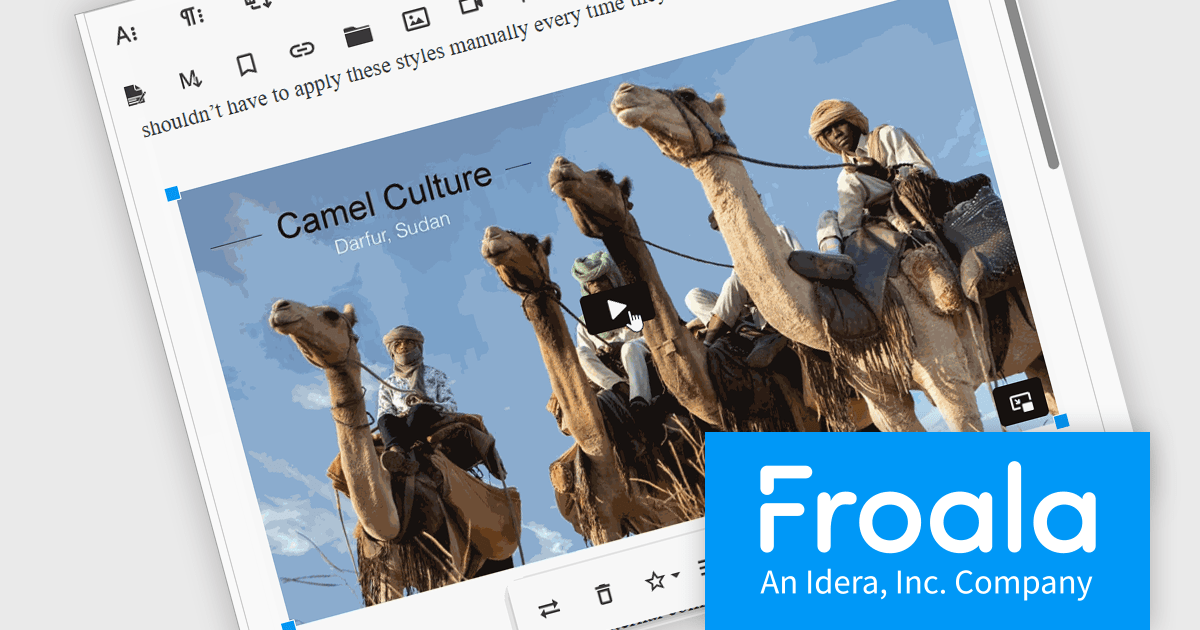
Froala Editor is a lightweight, modern WYSIWYG (What You See Is What You Get) rich text editor designed for web applications, offering a clean interface, fast performance, and extensive customization options. Built with a focus on usability and developer flexibility, it provides a wide range of formatting tools, media management capabilities, and advanced features such as inline editing, collaborative functionality, and mobile responsiveness. Its modular architecture, robust API, and broad framework integrations make it suitable for embedding into enterprise-level platforms as well as smaller applications requiring a polished content-editing experience.
The Froala Editor 4.7.1 update improves the video plugin by adding support for the latest Vimeo link formats, allowing the editor to automatically recognize and embed new Vimeo URLs without manual adjustments. This enhancement ensures that videos reliably render and play directly inside the WYSIWYG editor, giving authors an immediate, accurate preview while reducing issues with incompatible or broken links and improving overall embedding consistency.
To see a full list of what's new in v4.7.1, see our release notes.
Froala Editor is licensed per product and domain. It is available as an annual or perpetual license with version upgrades and support. See our Froala Editor licensing page for full details.
For more information, visit our Froala Editor product page.

For the past two years, ComponentSource has proudly partnered with MDBootstrap to bring high quality UI tools to developers worldwide. Through this partnership, customers gain easy access to MDB’s rich collection of responsive, modern components and templates that help teams build polished and efficient web applications.
Material Design for Bootstrap, widely known as MDB, is a leading front end framework created for developers, by developers. It offers more than five thousand UI components and templates that help teams create visually appealing and fully responsive applications that follow Material Design principles. Trusted by a global community of more than three million developers and designers, and chosen by organizations such as NASA, Amazon, Nike and IKEA, MDB continues to be a reliable and influential tool within the ComponentSource catalog.
The collaboration between ComponentSource and MDBootstrap delivers real benefits to the developer community by combining MDB’s high-quality design tools with ComponentSource’s global reach, licensing expertise, and dedicated customer service. Together, they simplify the adoption of MDB solutions, supporting teams as they build faster and deliver modern, consistent digital experiences. ComponentSource looks forward to the future and to many more years of helping developers create exceptional web applications.
Learn more about MDBootstrap.
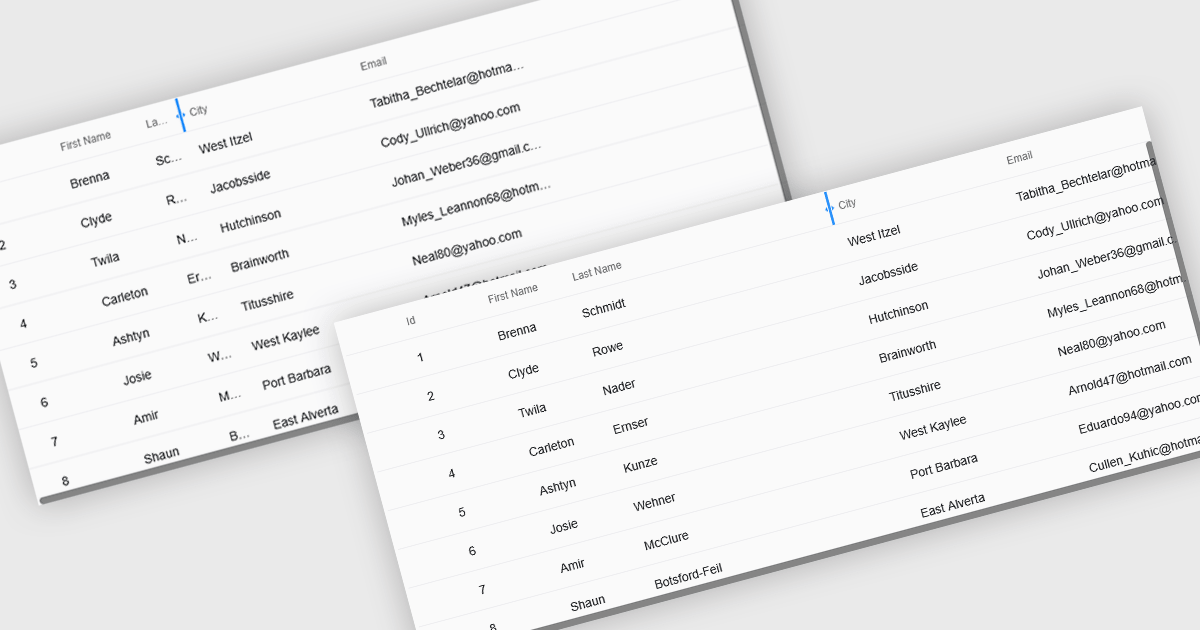
Resizable grid columns let users adjust the width of each column in a data table, giving them direct control over how information is displayed. This improves readability by preventing text from being cut off, reduces clutter by narrowing less important fields, and creates a cleaner, more efficient workspace. It is especially useful with large datasets, long product names, detailed descriptions, or mixed data types, such as expanding a “Description” column to read full text or narrowing numeric columns to compare figures quickly. Whether used in dashboards, admin panels, reporting tools, or data entry systems, column resizing enhances usability, speeds up analysis, and supports a more personalized viewing experience.
Several React grid controls offer support for expanding and resizing columns including:
For an in-depth analysis of features and price, visit our React grid controls comparison.
Tel: (888) 850 9911
Fax: +1 770 250 6199


