













Fornecedor oficial
Como distribuidores oficiais e autorizados, nós fornecemos licenças legítimas diretamente de mais de 200 editores de software.
Ver todas as nossas marcas.
CodeRush Ultimate is a Visual Studio extension designed to improve developer productivity and creativity. It empowers you to generate sophisticated code, automate tedious tasks, and navigate your codebase effortlessly, all while boosting code quality and readability. By eliminating repetitive coding and providing intelligent assistance, CodeRush Ultimate frees you to focus on the big picture, helping you deliver more features faster and with higher quality.
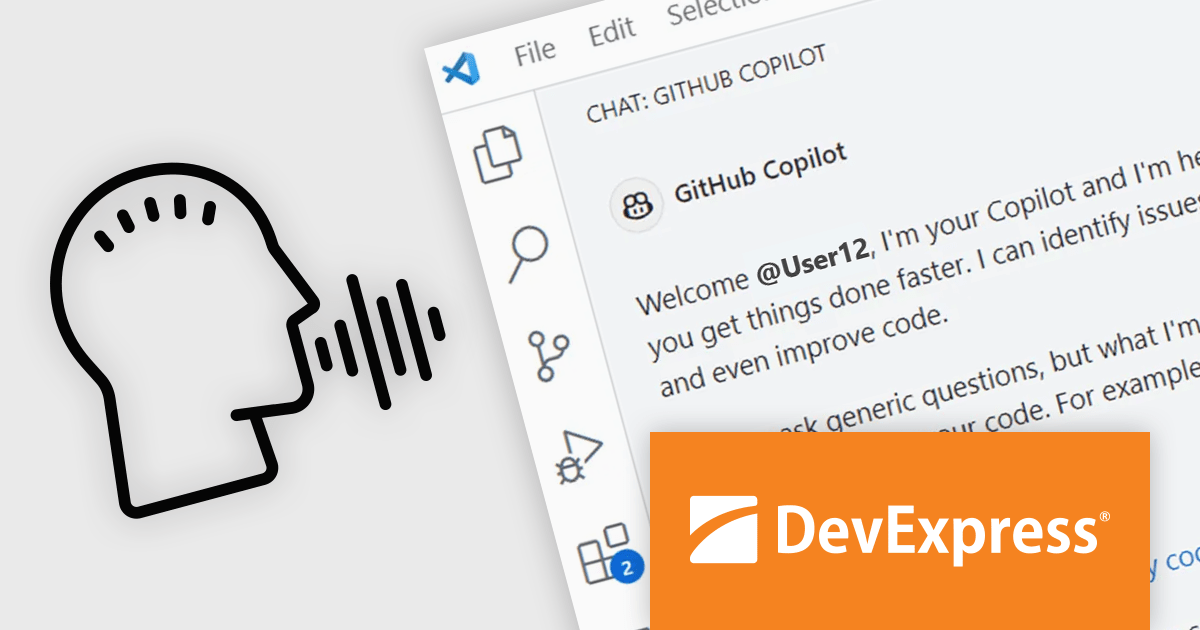
The CodeRush Ultimate 24.1 release introduces 'Voice for Copilot' a revolutionary feature that lets you interact with the popular GitHub Copilot Chat service using natural spoken prompt. Simply hold down the left Ctrl key and say "Hey Copilot" followed by your coding question to trigger the assistant. If you need help understanding a specific method or class in your code you can refer to "this method" or "this class" in your voice query, and CodeRush will select the relevant method in order to provide Copilot with the necessary context for a seamless conversation. Voice for Copilot streamlines your workflow, eliminates tedious typing, and fosters a more intuitive way to leverage the artificial intelligence expertise of Copilot, boosting your coding efficiency and productivity.
To see a full list of what's new in version CodeRush Ultimate 24.1, see our release notes.
CodeRush Ultimate is licensed per developer and is available as a Perpetual License with a 12 month support and maintenance subscription. See our CodeRush Ultimate licensing page for full details.
CodeRush Ultimate is available to buy in the following products:
VectorDraw Developer Framework (VDF) is a software development toolkit that equips you to create, edit, and manage 2D and 3D drawings directly within your applications. This framework provides a comprehensive graphics engine library compatible with popular vector formats and includes tools for exporting drawings to various file types, including PDF. VDF utilizes an object-oriented approach and offers ActiveX and .NET integration for seamless incorporation into your development workflow.
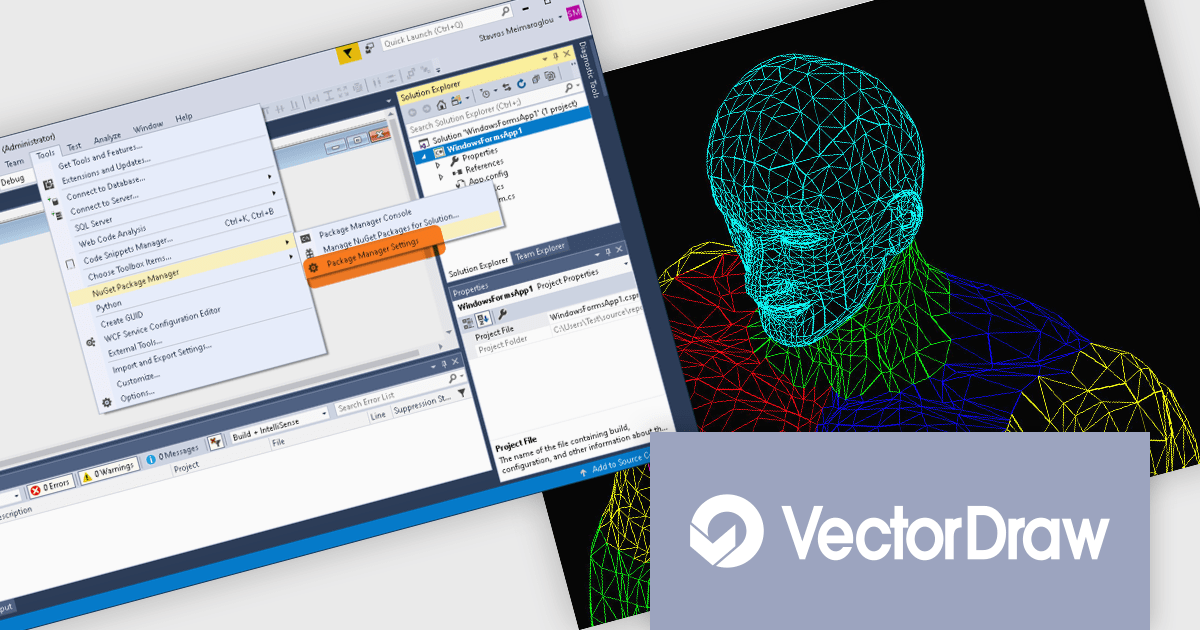
The VectorDraw Developer Framework (VDF) v11 update streamlines the integration of advanced drawing capabilities into your .NET 6 applications with the introduction of a new core library. The added VectorDraw.Drawing.Framework.Net-6.x nuget library (now available alongside the VectorDraw.Drawing.Framework.Net-4.x) leverages the performance and features of .NET 6, providing a more efficient and robust foundation for incorporating vector graphics into your projects.
To see a full list of what's new in v11, see our release notes.
VectorDraw Developer Framework (VDF) is licensed per developer, per year. During the annual license period you will receive all major and minor upgrades of the VDF libraries plus support from the VDF support team. To continue to use the software you will need to renew your license each year. See our VectorDraw Developer Framework (VDF) licensing page for full details.
Learn more on our VectorDraw Developer Framework (VDF) product page.
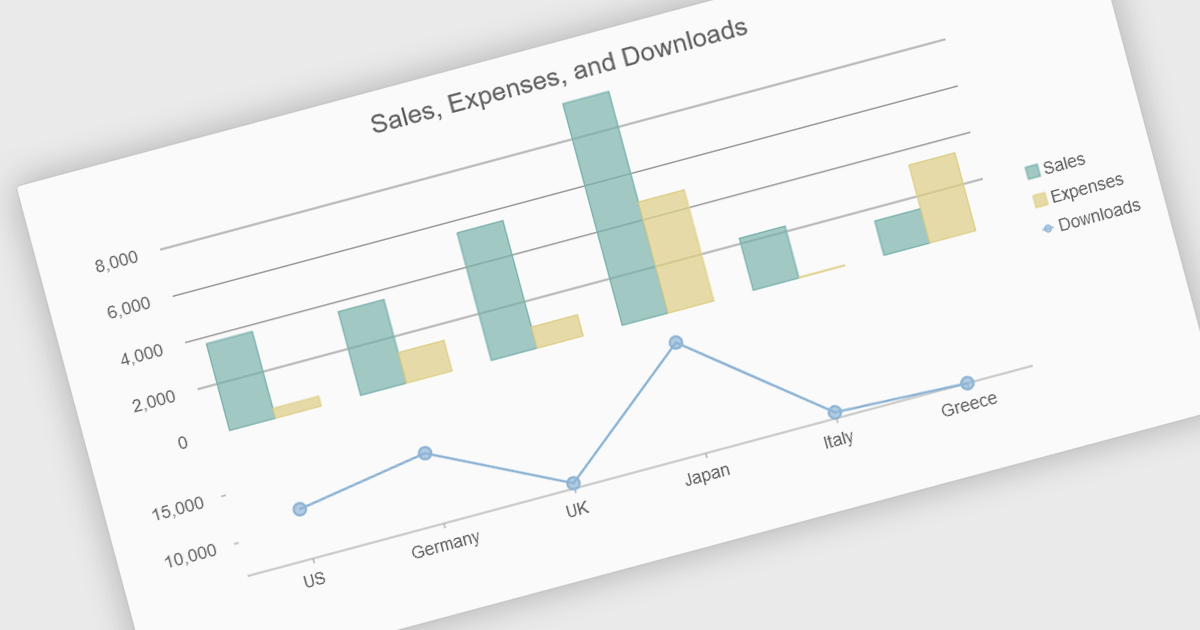
Combination charts (also known as combo charts) are visualizations that integrate multiple chart types, such as bar, line, and area charts, within a single display. This approach allows developers to show varied data sets and relationships in a cohesive, comprehensive manner, facilitating more nuanced data analysis and comparison. The primary benefits include their ability to convey complex information efficiently, their flexibility in showcasing different data trends simultaneously, and their enhanced readability for end-users who need to interpret diverse metrics at a glance. This versatility makes combination charts an invaluable tool for presenting multifaceted data insights in dynamic, interactive web applications.
Several JavaScript / HTML5 chart controls offer combination charts including:
For an in-depth analysis of features and price, visit our comparison of JavaScript / HTML5 Chart Controls.
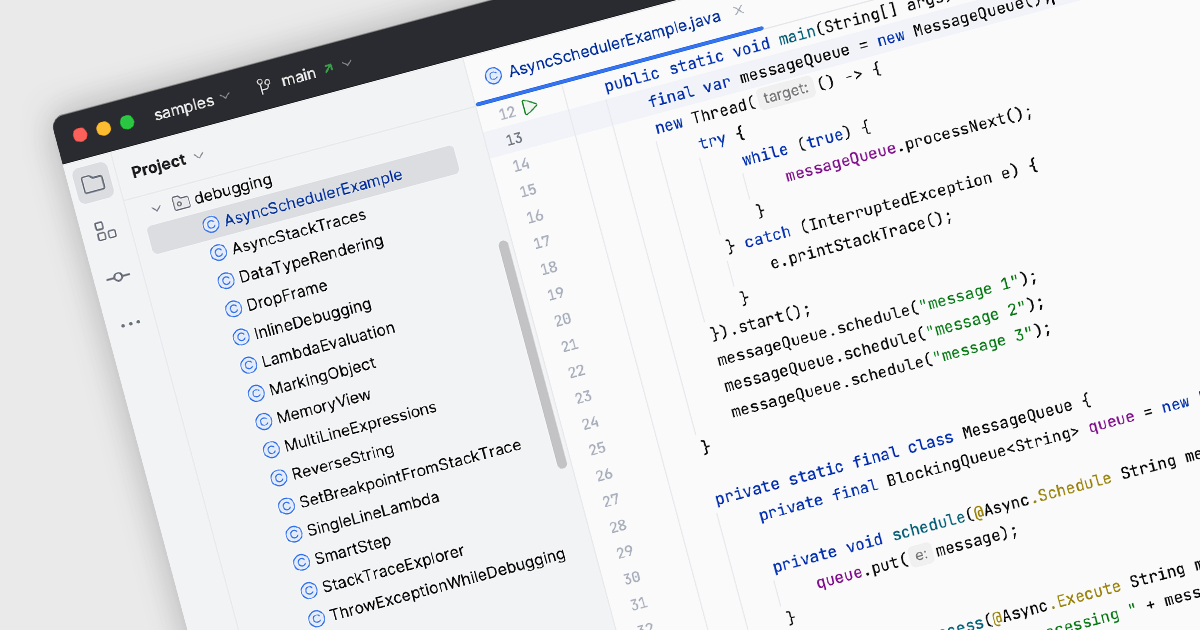
Java is a high-level, class-based, object-oriented programming language that is designed to have as few implementation dependencies as possible and can run on all platforms that support it, without needing to recompile. Support for Java in an integrated development environment (IDE) means that it has an array of built-in tools and features to facilitate the development of Java applications. This support often includes syntax highlighting for easy code readability, code completion to suggest code snippets as you type, and code debugging to test for errors and identify causes. Such functionality enhances productivity, improves code quality, and simplifies the development process for Java developers.
Several IDEs include support for Java, including:
For an in-depth analysis of features and price, visit our comparison of IDEs.
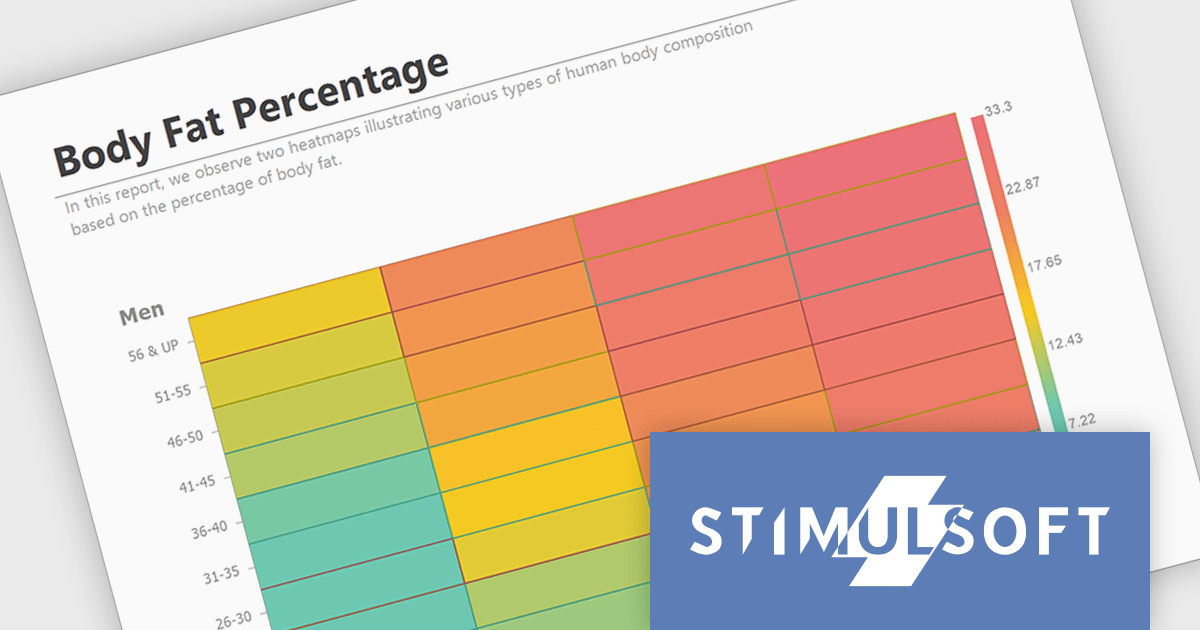
Stimulsoft Reports.JS provides a robust reporting toolkit designed specifically for JavaScript applications. This library leverages a client-side architecture, offering a pure JavaScript report engine for efficient report rendering directly within web browsers. The solution includes a user-friendly report designer for building reports with various data sources and visualizations, along with a report viewer for seamless integration and display within your JavaScript applications. This eliminates the need for server-side dependencies or browser plugins, simplifying the development process for embedding powerful reporting functionalities into your web projects.
The Stimulsoft Reports.JS 2024.3 update adds a powerful new data visualization tool: the heatmap chart. This intuitive chart type excels at revealing patterns and trends within large datasets. By visually encoding data values through color gradients, heatmaps simplify complex information, allowing users to quickly identify areas of high, medium and low concentration. Stimulsoft Reports.JS seamlessly integrates heatmaps into your existing reporting workflows, enhancing data exploration and communication for your users.
To see a full list of what's new in version 2024.3, see our release notes.
Stimulsoft Reports.JS is licensed per developer and is available as a Perpetual license with 1 year support and maintenance. See our Stimulsoft Reports.JS licensing page for full details.
Stimulsoft Reports.JS is available in the following products:
Tel: (888) 850 9911
Fax: +1 770 250 6199


