


Fornecedor oficial
Como distribuidores oficiais e autorizados, nós fornecemos licenças legítimas diretamente de mais de 200 editores de software.
Ver todas as nossas marcas.
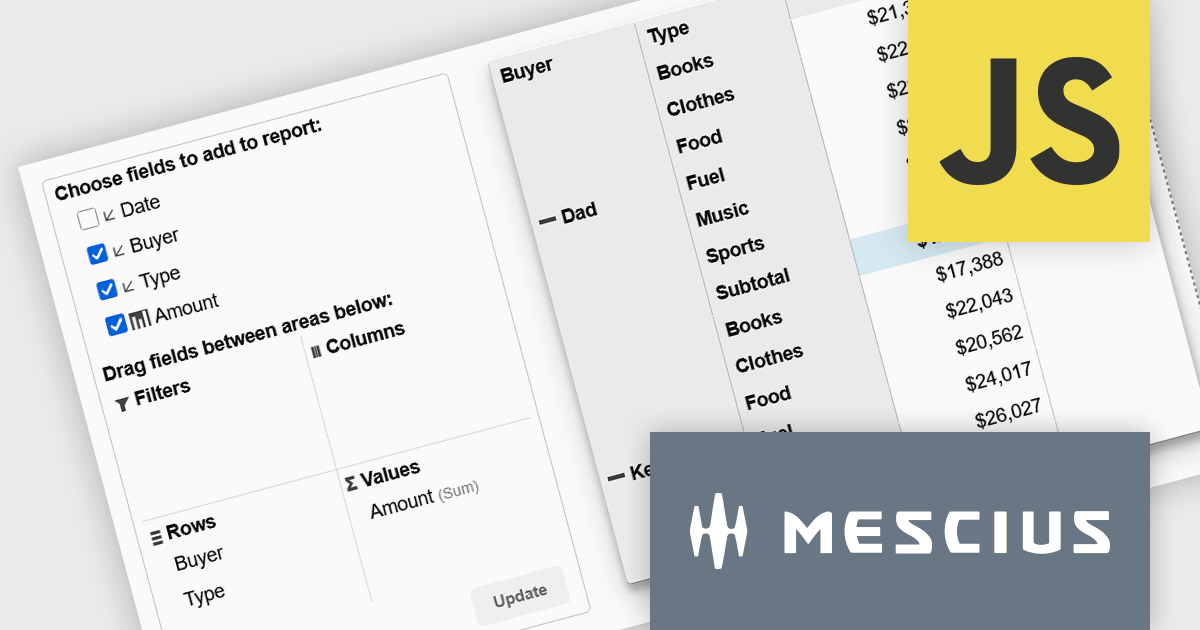
Wijmo is a cutting-edge collection of over 100 high-performance JavaScript UI controls designed for modern enterprise applications. It empowers developers to deliver superior user experiences with fully responsive, touch-friendly, and accessible components and works with any popular JavaScript framework - including Angular, React, Vue, Svelte, or pure JavaScript/TypeScript - for rapid application development across modern web and mobile platforms.
On Wednesday, July 8th at 11:00 AM EST, MESCIUS is presenting a CodeClinic Live Webinar demonstrating how to create executive-ready dashboards without requiring you to build complex aggregation logic from scratch. Joel Parks, Wijmo Product Manager for MESCIUS, will demonstrate how PivotGrid and PivotChart work together to deliver a seamless analytics experience. Key takeaways include:
Register for the Live Webinar today and mark your calendar for July 8th.
Wijmo is licensed per developer. Developer Licenses are perpetual and include 1 year Subscription which provides upgrades, including bug fixes and new features. See our Wijmo licensing page for full details.
Learn more on our Wijmo product page.
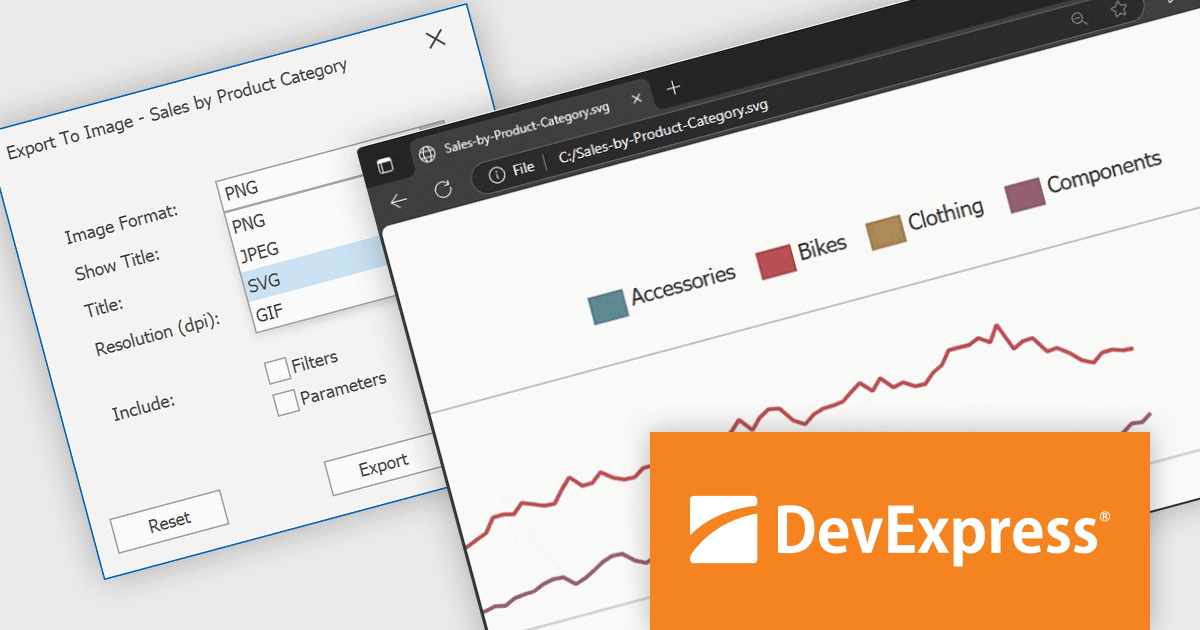
DevExpress BI Dashboard (part of DevExpress Universal) empowers you to craft interactive dashboards for desktop, web and mobile applications. It provides a visual designer for building dashboards without writing code, allowing you to drag-and-drop various data visualization widgets onto the canvas. These widgets connect to your data sources and update dynamically, offering real-time insights to end users. The tool also supports customization through properties and events, enabling you to tailor the look and feel of the dashboards to perfectly integrate with your application's design.
The DevExpress BI Dashboard v25.1 update adds support for exporting entire dashboards, specific items, or tab pages to Scalable Vector Graphics (SVG) format. This enhancement allows users and analysts to create resolution-independent, high-quality exports that maintain clarity at any size. SVG output is particularly useful for printed reports, shared presentations, or integration into documentation, where visual fidelity is essential.
To see a full list of what's new in version 25.1, see our release notes.
DevExpress BI Dashboard is included as part of DevExpress Universal which is licensed per developer and is available as a Perpetual License with a 12 month support and maintenance subscription. See our DevExpress Universal licensing page for full details.
DevExpress BI Dashboard is available in the following products:
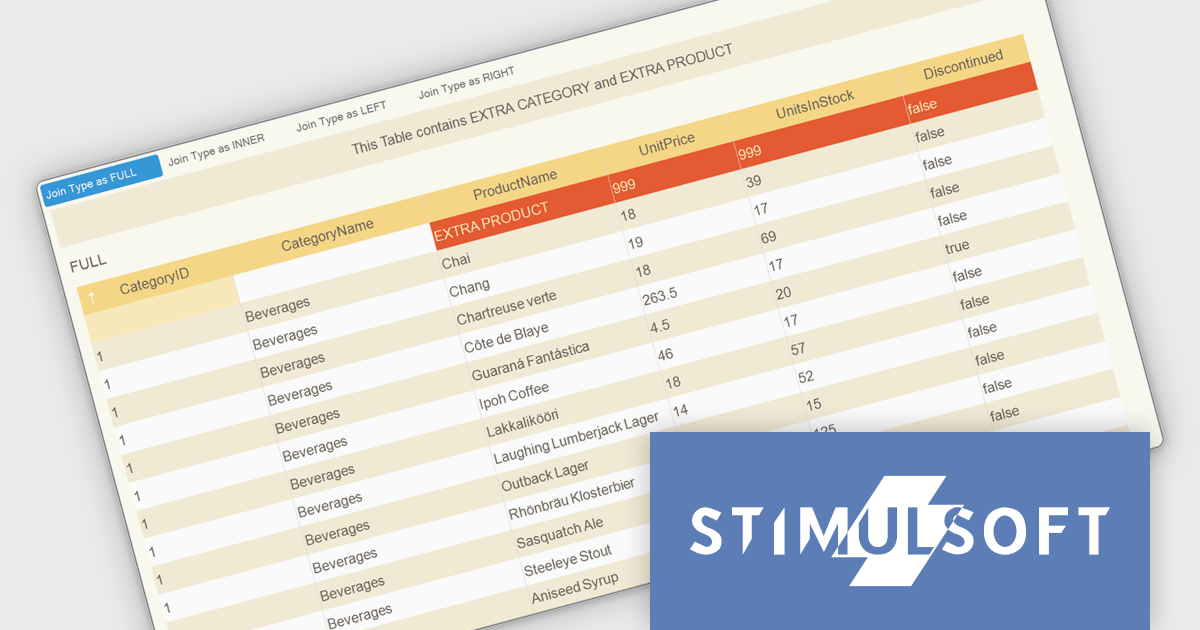
Stimulsoft Dashboards.WEB is a versatile suite of tools for crafting interactive data visualizations for web and desktop applications. It empowers developers to embed intuitive dashboards across various platforms, using the platform-specific components or a centralized cloud designer. With rich data analysis elements, extensive customization options, and pre-built templates, Stimulsoft Dashboards helps you transform complex data into clear, actionable insights for any audience.
The Stimulsoft Dashboards.WEB 2025.3.1 update introduces support for selecting data join types including Full, Inner, Left and Right when combining tables during dashboard rendering and data transformation. This enhancement gives developers precise control over how datasets are merged, ensuring the resulting structure accurately reflects the intended relationships between records. By configuring join types directly in the relationship editor, developers can optimize data grouping, maintain consistency across transformations and visualizations, and produce more reliable and context-aware analytics.
To see a full list of what's new in 2025.3.1, see our release notes.
Stimulsoft Dashboards.WEB is licensed per developer and is available as a perpetual license with 1 year support and maintenance. See our Stimulsoft Dashboards.WEB licensing page for full details.
Stimulsoft Dashboards.WEB is available individually or as part of Stimulsoft Ultimate.
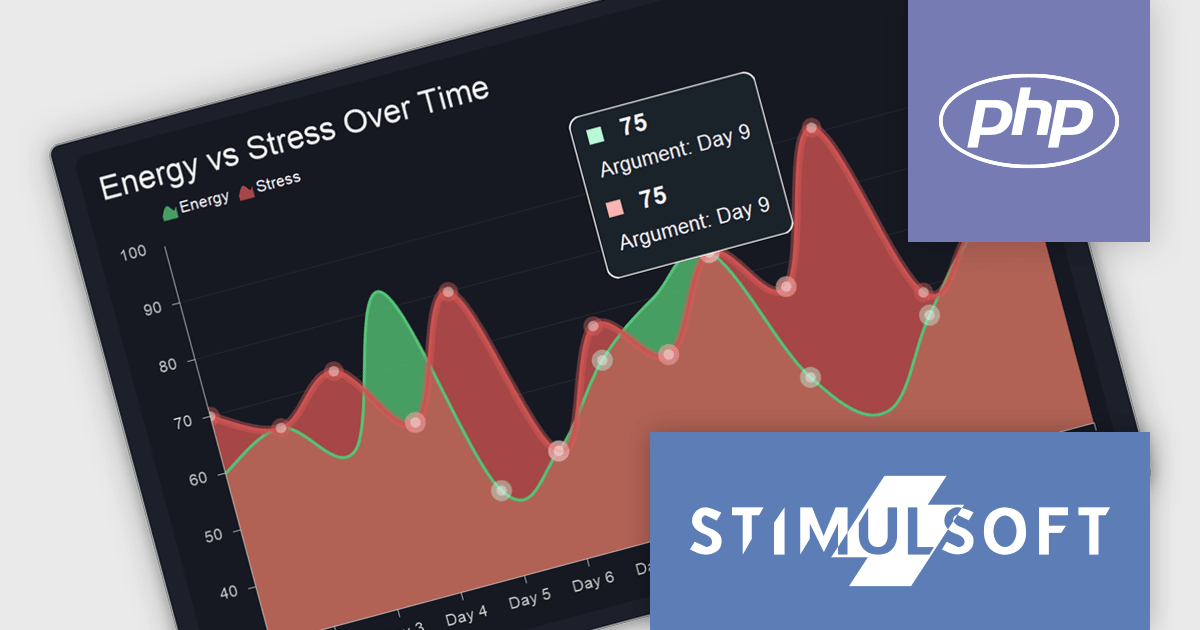
Stimulsoft Dashboards.PHP is a powerful dashboard and reporting tool designed for PHP web applications. It enables developers to create interactive and visually appealing dashboards that provide real-time insights into data. With its intuitive interface and extensive features, Stimulsoft Dashboards.PHP helps users to analyze complex data sets, visualize trends, and make data-driven decisions effectively.
The Stimulsoft Dashboards.PHP 2025.3.1 update improves data clarity and accuracy by introducing a new multi tooltip feature. This enhancement ensures that when hovering over a data point, all matching values are displayed in the tooltip, rather than just the last one as in previous versions. For developers building dashboards with overlapping or identical values across series or categories, this provides a more complete and immediate view of the underlying data, reducing ambiguity and improving the efficiency of data interpretation during analysis or debugging.
To see a full list of what's new in 2025.3.1, see our release notes.
Stimulsoft Dashboards.PHP is licensed per developer and is available as a perpetual license with 1 year support and maintenance. See our Stimulsoft Dashboards.PHP licensing page for full details.
Stimulsoft Dashboards.PHP is available individually or as part of Stimulsoft Ultimate.
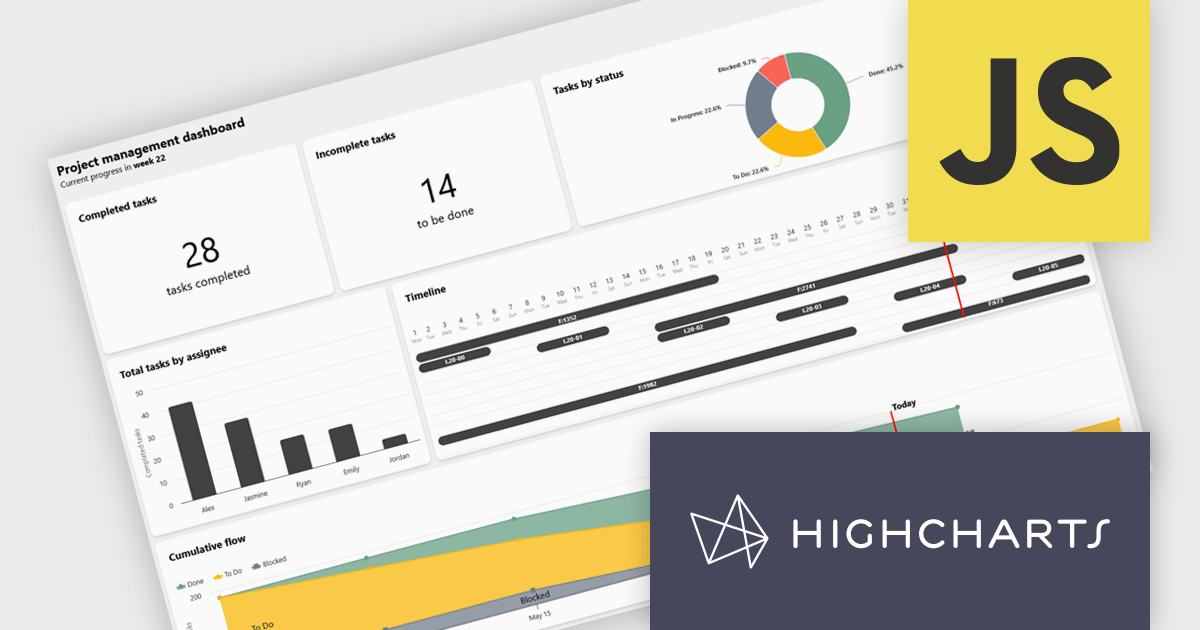
Highcharts Dashboards by Highsoft is a comprehensive platform tailored for software developers seeking efficient data visualization solutions. It offers a robust toolkit for creating interactive dashboards and charts, leveraging the Highcharts library renowned for its flexibility and performance. With support for various data formats and extensive customization options, developers can seamlessly integrate dynamic visualizations into their applications. Highsoft's dashboards empower developers to convey complex data insights effectively, enhancing user experience and decision-making capabilities within their software projects.
Highcharts Dashboards offers a Project Management dashboard that gives users a real-time view of project progress, team workload, and milestones. By consolidating key metrics into an interactive interface, it improves tracking, resource planning, and timeline management. Users can assess deliverable status, identify task dependencies, and align team capacity with project goals. Visual tools like Gantt charts and status overviews improve communication, reduce misalignment, and support more informed decision-making across both agile and traditional workflows.
Highcharts Dashboards is licensed per developer as an Annual or Perpetual License with Internal, Saas, SaaS+ and OEM distribution options. The annual license includes support and all product updates for 1 year and must be renewed to continue to use the software. The perpetual license includes an "Advantage Subscription" for 1 to 5 years which provides support and updates for that period. If you do not renew Advantage then you may continue to use the software at the last release available during the active Advantage period. See our Highcharts Dashboards licensing page for full details.
Learn more on our Highcharts Dashboards product page.
Tel: (888) 850 9911
Fax: +1 770 250 6199


