


Fornecedor oficial
Como distribuidores oficiais e autorizados, nós fornecemos licenças legítimas diretamente de mais de 200 editores de software.
Ver todas as nossas marcas.
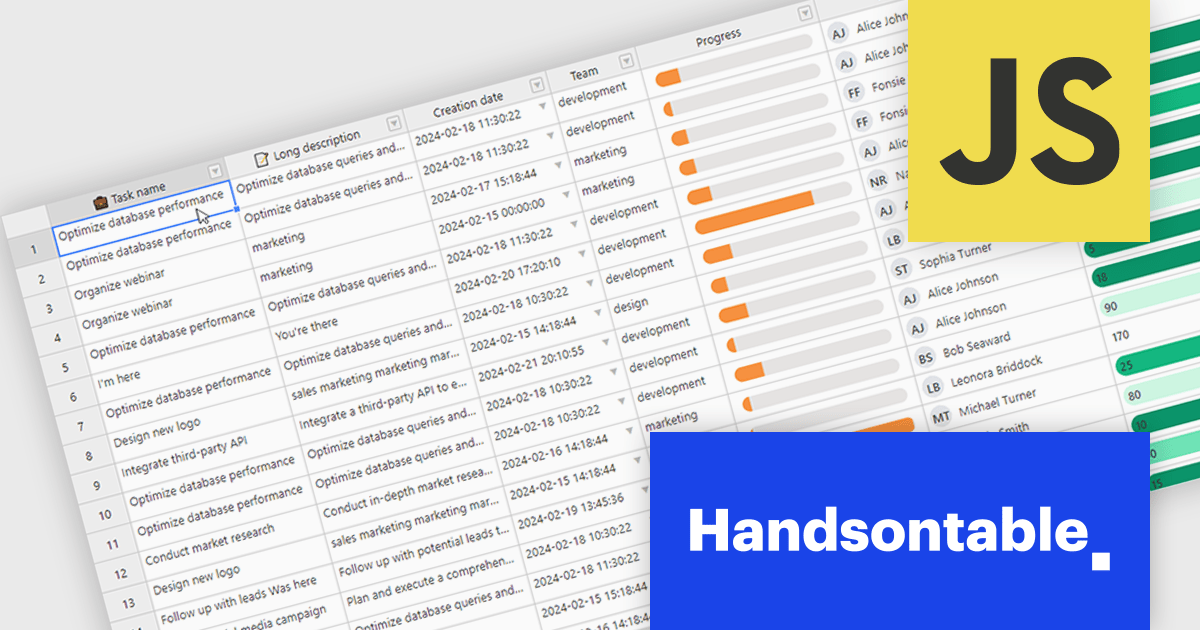
Handsontable is a JavaScript library designed to help developers build interactive data grids into their web applications. Offering a familiar spreadsheet-like interface, it allows users to edit, sort, and filter data with ease. Highly customizable and compatible with popular frameworks like React and Angular, Handsontable empowers developers to build robust data manipulation features into their web applications.
Handsontable 14.2.0 improves cell re-rendering using the React wrapper. The wrapper now uses memoization to optimize performance during user interactions like cell editing or scrolling in the grid, allowing the wrapper to remember the previous state and only update the elements that have actually changed. This smarter approach results in a smoother and more stable experience in your Handsontable apps, especially for complex custom cell types.
To see a full list of what's new in version 14.2.0, see our release notes.
Handsontable is licensed per developer and is available as an Annual or Perpetual license with 1 year support and maintenance. See our Handsontable licensing page for full details.
For more information, visit our Handsontable product page.

Conditional formatting in a grid allows you to dynamically alter the visual style of cells based on specific criteria within your data. This functionality enhances readability and user experience by highlighting important information. For instance, negative values can be displayed in red, exceeding values in bold, and empty cells with a light gray background, all within the grid itself. This reduces the need for users to manually scan through data and immediately draws attention to critical elements.
Several React grid controls offer conditional formatting, including:
For an in-depth analysis of features and price, visit our comparison of React Grid controls.
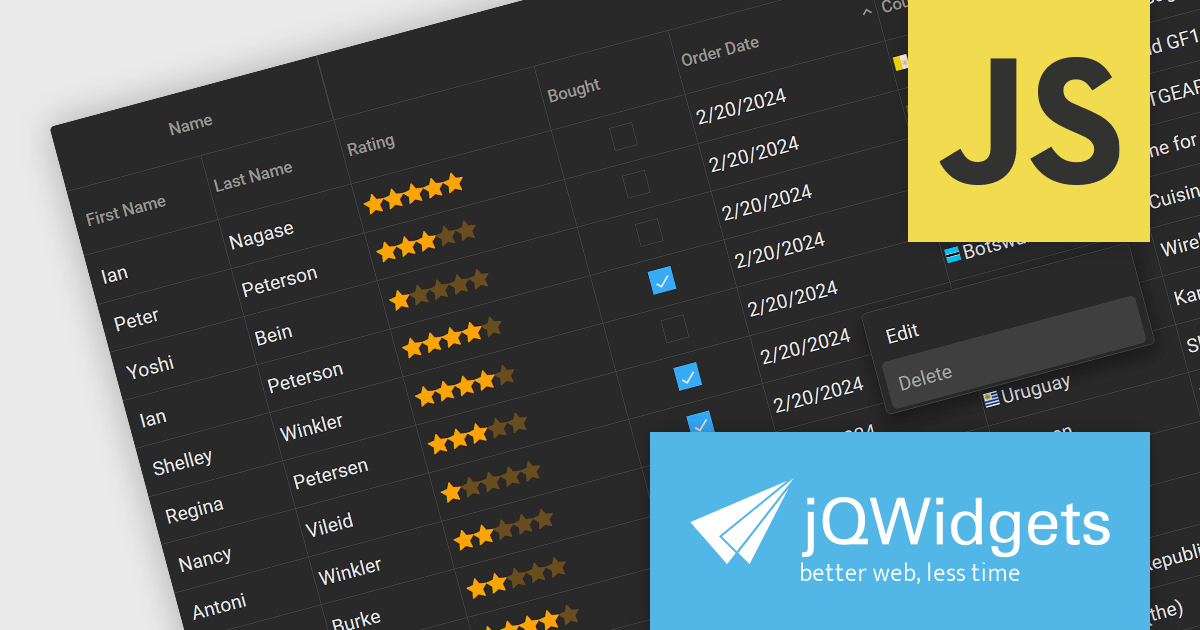
jQWidgets is a comprehensive JavaScript UI framework offering a robust collection of over 60 widgets, themes, and utilities for building professional-grade, cross-platform web applications. Built on jQuery, HTML5, and CSS, it provides extensive functionality including data grids, charts, navigation, input validation, and more. jQWidgets simplifies web development, ensuring your applications work seamlessly across desktop browsers, tablets, and smartphones.
The jQWidgets v19 release introduces a built-in context menu. This menu appears upon right-clicking within the grid, offering users context-specific options relevant to their current selection or interaction. This eliminates the need to navigate to separate menus or tools, streamlining user interactions and significantly improving usability. By providing immediate access to relevant actions within the grid itself, users can work more efficiently and productively. This new addition enhances the overall user experience for anyone working with jqxGrid.
To see a full list of what's new in v19.0.0, see our release notes.
jQWidgets is licensed per developer and is available as a Perpetual license 1 year support and maintenance. See our jQWidgets licensing page for full details.
Learn more on our jQWidgets product page.
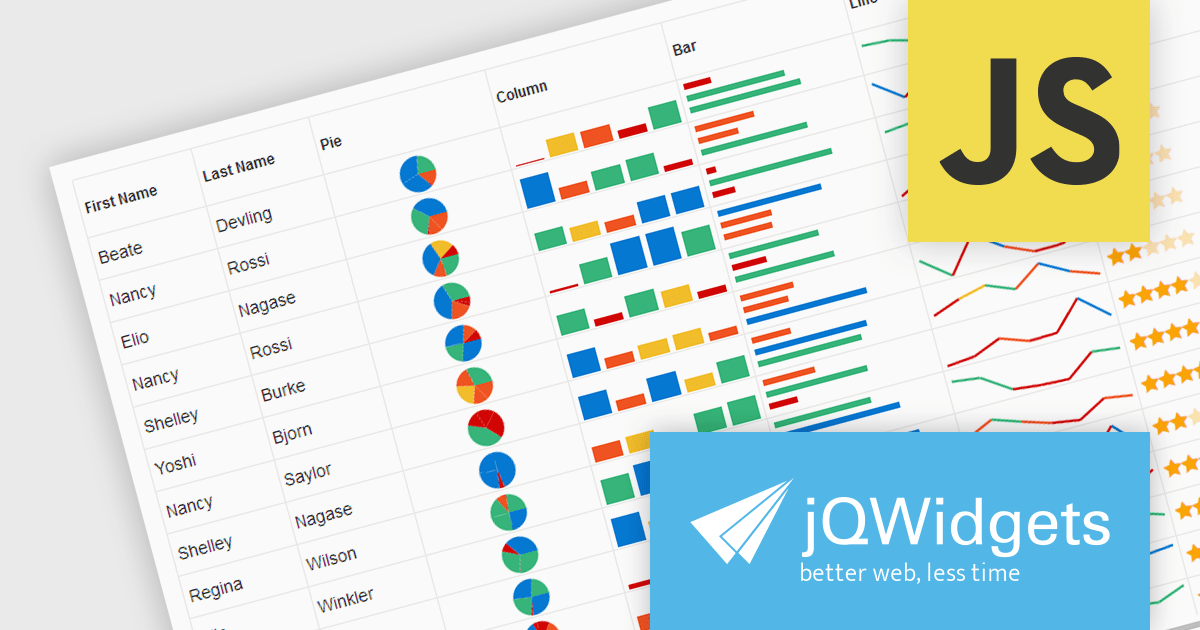
jQWidgets is a comprehensive JavaScript UI framework offering a robust collection of over 60 widgets, themes, and utilities for building professional-grade, cross-platform web applications. Built on jQuery, HTML5, and CSS, it provides extensive functionality including data grids, charts, navigation, input validation, and more. jQWidgets simplifies web development, ensuring your applications work seamlessly across desktop browsers, tablets, and smartphones.
The jQWidgets v19 release introduces support for integrating sparklines directly into jqxGrid. These miniature charts, plotted directly within grid cells, provide a quick and insightful way to visualize trends and patterns in your data without requiring additional charting libraries. This enhancement significantly bolsters jqxGrid's data visualization capabilities, allowing you to create more informative and engaging data presentations.
To see a full list of what's new in v19.0.0, see our release notes.
jQWidgets is licensed per developer and is available as a Perpetual license 1 year support and maintenance. See our jQWidgets licensing page for full details.
Learn more on our jQWidgets product page.
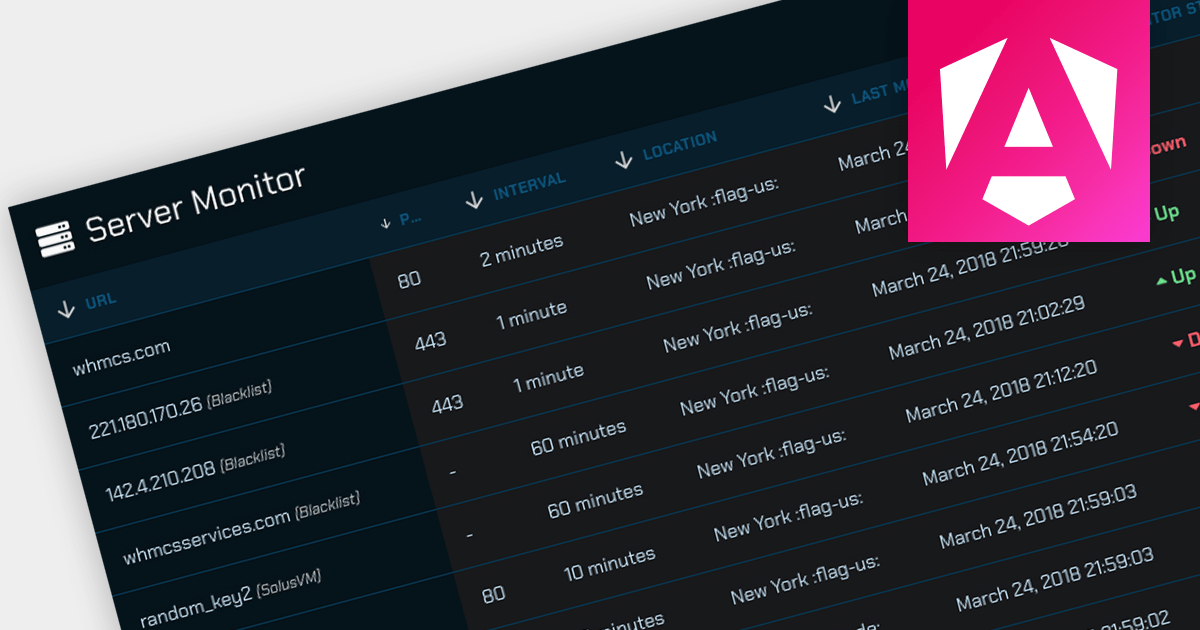
Offloading sorting tasks to a server (known as remote server sorting or server-side sorting) enables large datasets to be handled efficiently without overwhelming the client. This minimizes data transmission and leads to snappier web applications. Moreover, server-side sorting boosts scalability by ensuring processing happens on the server, freeing up client resources. This translates to faster response times, especially for large datasets, making the user experience smoother. This approach empowers developers to build responsive and scalable web applications that excel at managing and presenting sorted data.
Several Angular grid controls offer sorting on the remote server, including:
For an in-depth analysis of features and price, visit our comparison of Angular Grid controls.
Tel: (888) 850 9911
Fax: +1 770 250 6199


