


Fornecedor oficial
Como distribuidores oficiais e autorizados, nós fornecemos licenças legítimas diretamente de mais de 200 editores de software.
Ver todas as nossas marcas.
The DevExpress Office File API is a robust library designed to simplify the creation, editing, and processing of popular office document formats, including Word, Excel, PowerPoint, and PDF. It allows developers to integrate advanced document management features into their applications without relying on external software like Microsoft Office. Key features include document generation, data import/export, template customization, and seamless integration with modern platforms. The API supports advanced formatting, encryption, and digital signatures, ensuring secure and professional-grade output. Ideal for enterprise applications, it streamlines workflows for reporting, data analysis, and document automation, saving time and enhancing productivity for developers and end-users alike.
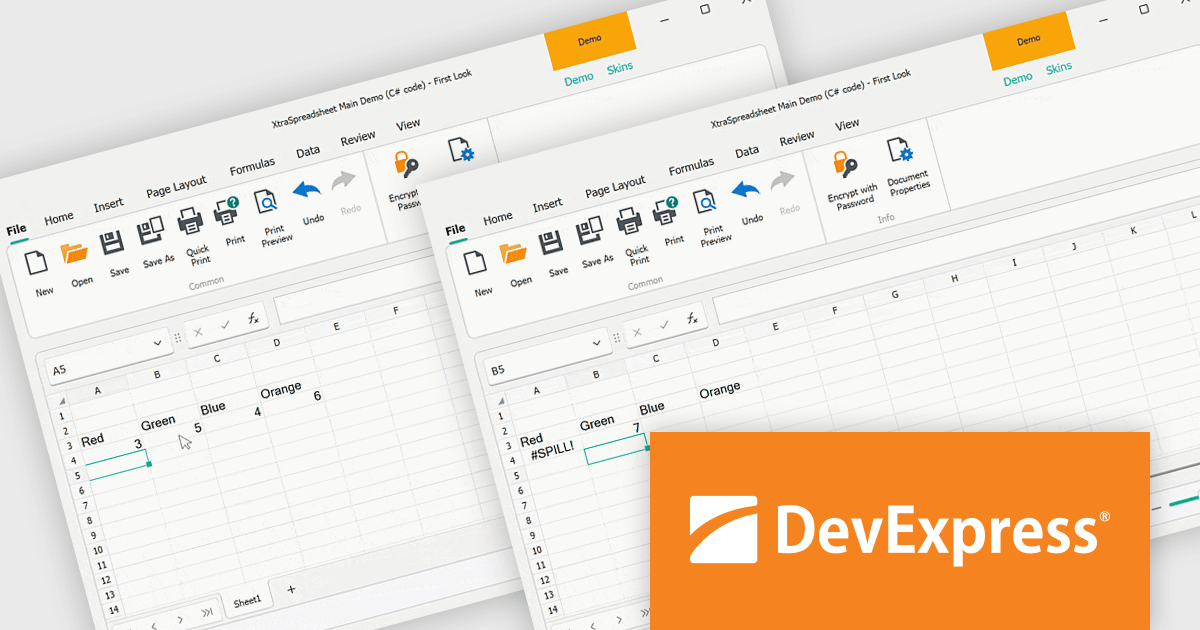
The DevExpress Office File API v24.2 update introduces support for dynamic array formulas, enabling developers to enhance spreadsheet functionality with automated formula calculations that dynamically spill into adjacent cells. This update simplifies data manipulation by allowing efficient recalculations, importing, and exporting of Excel documents with dynamic array formulas. Developers gain precise control through APIs that manage dynamic array formulas programmatically, identify spill ranges, and customize behavior to suit specific application needs. This capability not only streamlines complex data workflows but also ensures seamless compatibility with modern Excel features, offering greater flexibility and efficiency in application development.
To see a full list of what's new in version 24.2, see our release notes.
DevExpress Office File API is licensed per developer and is available as a Perpetual License with a 12 month support and maintenance subscription. See our DevExpress Office File API licensing page for full details.
DevExpress Office File API is available individually or in the following products:
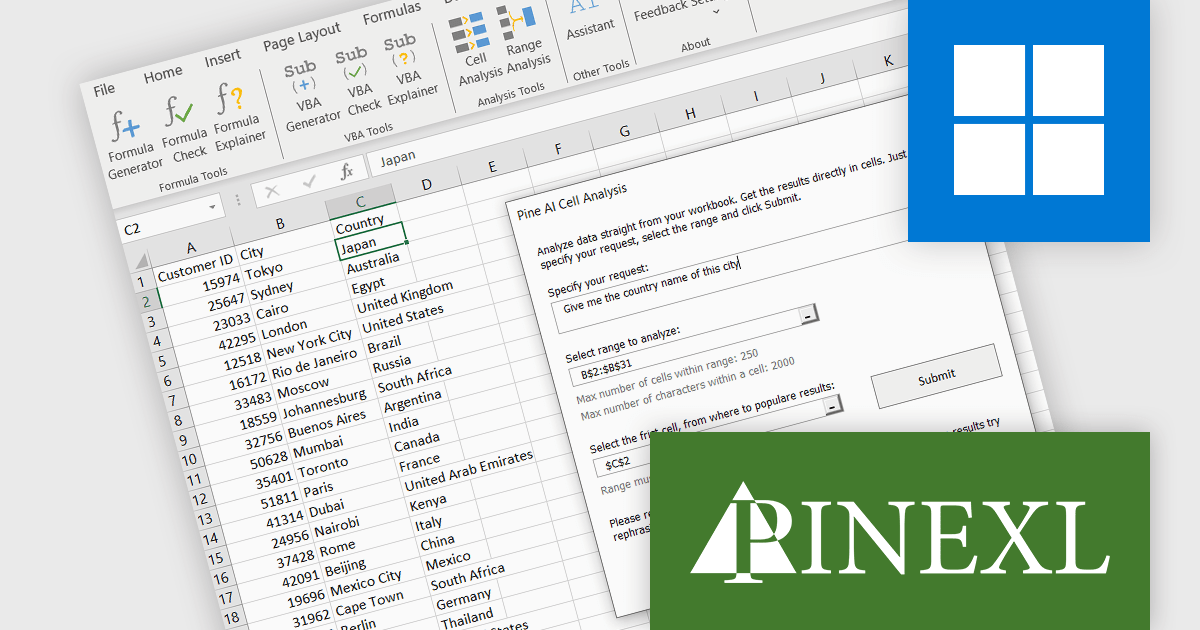
Pine AI Excel Add-In, developed by Pinexl, integrates OpenAI's ChatGPT into Microsoft Excel, enabling users to generate, debug, and interpret complex formulas and Visual Basic for Applications (VBA) code by simply describing their requirements. This tool enhances productivity by automating tasks such as data analysis, summarization, transformation, and translation directly within Excel spreadsheets. For instance, users can extract specific information from unstructured data, fill in missing details like country names based on city data, and translate text without leaving the Excel environment. By streamlining these processes, Pine AI reduces the time spent on manual data manipulation and extensive online research, making it a valuable asset for professionals seeking to optimize their workflow within Excel.
Pine AI's data analysis functionality has been separated into two tools; Range Analysis and Cell Analysis. The Range Analysis tool is the data analysis function of the preceding Data Analysis tool, allowing you to evaluate and summarize a range of cells. The Pine AI Cell Analysis tool allows you to analyze individual cells, make requests on that data, and have the findings returned directly to another cell in the same or a new worksheet within your current active workbook. Use Pine AI Cell Analysis to extract strings from text, obtain additional information based on cell values, and even translate cell content into any language.
Pine AI Excel Add-In is licensed per user on an annual subscription basis. To continue using the software you will need an active subscription. See our Pine AI Excel Add-In licensing page for full details.
Learn more on our Pine AI Excel Add-In product page.
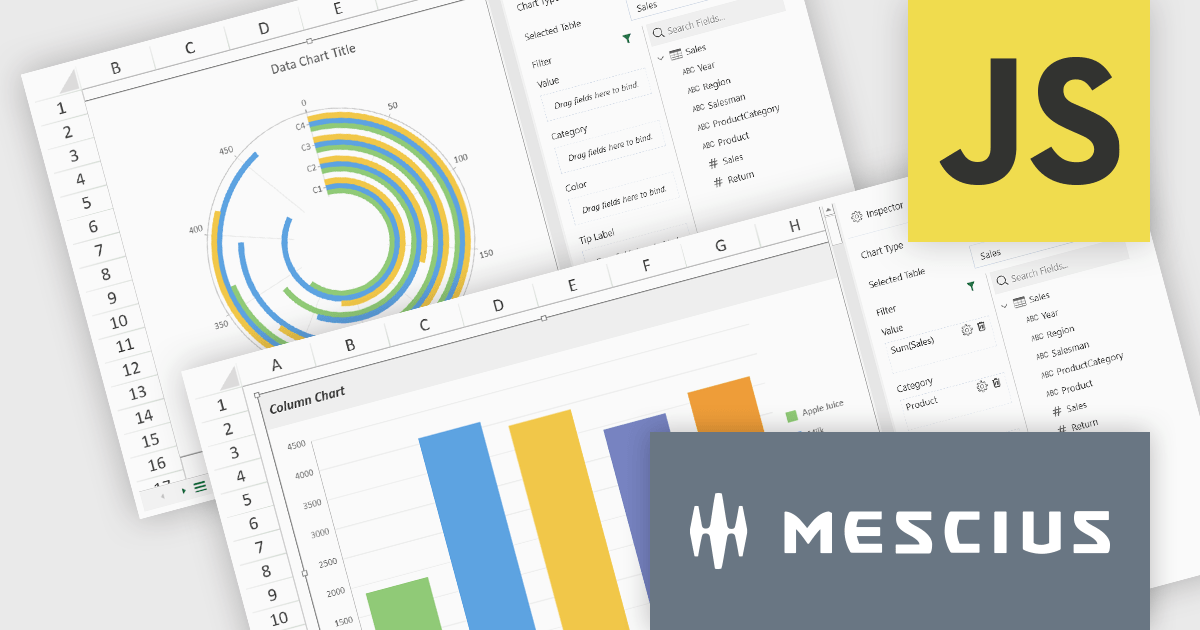
SpreadJS by MESCIUS is a high-performance JavaScript spreadsheet component designed to seamlessly integrate Excel-like functionality into web applications. It empowers developers to deliver robust spreadsheet experiences within their applications, complete with features like data import/export, complex formulas, conditional formatting, and extensive customization options. To extend its capabilities, SpreadJS offers a variety of optional add-ons, such as tools for reporting, charting, and data management. SpreadJS caters to a wide range of use cases, from financial modeling and data analysis to project management and interactive dashboards, ultimately allowing developers to build feature-rich and user-friendly web applications.
SpreadJS v18 introduces the DataCharts Add-On, a powerful new feature that lets you bind charts directly to external data managed by the Data Manager, eliminating the need to embed data within the workbook. This innovation streamlines workflows by reducing redundancy, simplifying updates, and enabling dynamic charting for both standalone spreadsheets and reports. For users of the ReportSheets Add-On, the DataCharts Add-On is seamlessly integrated, enhancing report creation with interactive, data-driven visuals. Developers seeking a flexible solution for external data visualization in other contexts can license the DataCharts Add-On separately, making it ideal for projects that demand adaptable, visually engaging charts.
For more information see our release notes.
SpreadJS is licensed per developer and includes 1 Year Maintenance (major and minor version releases and unlimited support phone calls). SpreadJS requires an Annual or Perpetual Deployment License. The optional Add-ons are available at an additional cost, and require a SpreadJS license. See our SpreadJS licensing page for full details.
For more information, visit our SpreadJS product page.
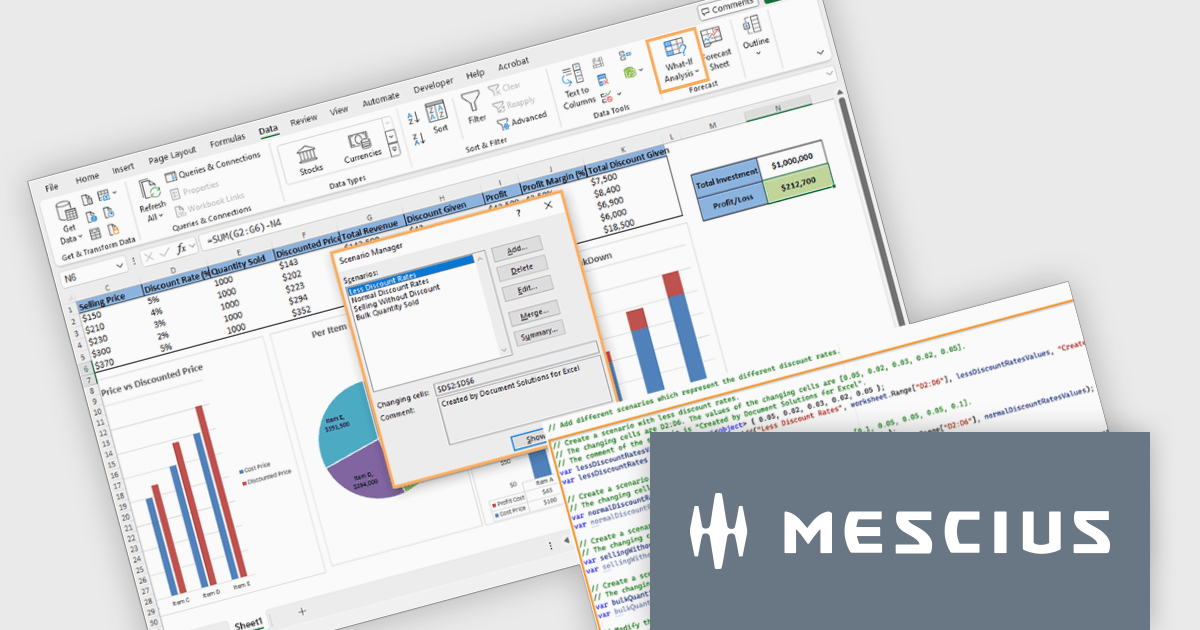
Document Solutions for Excel by MESCIUS is a comprehensive tool designed to streamline the creation, management, and distribution of Excel-based reports and documents. It simplifies tasks such as generating dynamic templates, automating complex data processing workflows, and ensuring consistency across reports. By integrating seamlessly with Excel, it caters to organizations needing efficient, scalable solutions for financial reporting, data analysis, and operational documentation. Its key benefits include reducing manual effort, minimizing errors, and improving productivity, making it ideal for finance teams, analysts, and any professionals managing high-volume data tasks.
The Document Solutions for Excel v8.0.0 update enhances what-if analysis capabilities by introducing programmatic support for scenarios, enabling developers to create, manage, and apply multiple sets of input values to dynamically assess their impact on spreadsheet calculations. This new functionality allows precise control over scenarios, including defining changing cells, locking or hiding scenarios for security, and modifying or deleting them as needed. Developers can seamlessly integrate scenario management into workflows, automate complex forecasting tasks, and ensure secure collaboration on protected worksheets. These enhancements streamline decision-making processes and provide robust tools for developing data-driven applications.
To see a full list of what's new in version 8.0.0, see our release notes.
Document Solutions for Excel is licensed per developer and is available in several license options for differing distribution needs. Team licenses are also available for multiple developers within the same organization. See our Document Solutions for Excel, .NET Edition licensing page for full details.
Document Solutions for Excel is available to buy in the following products:
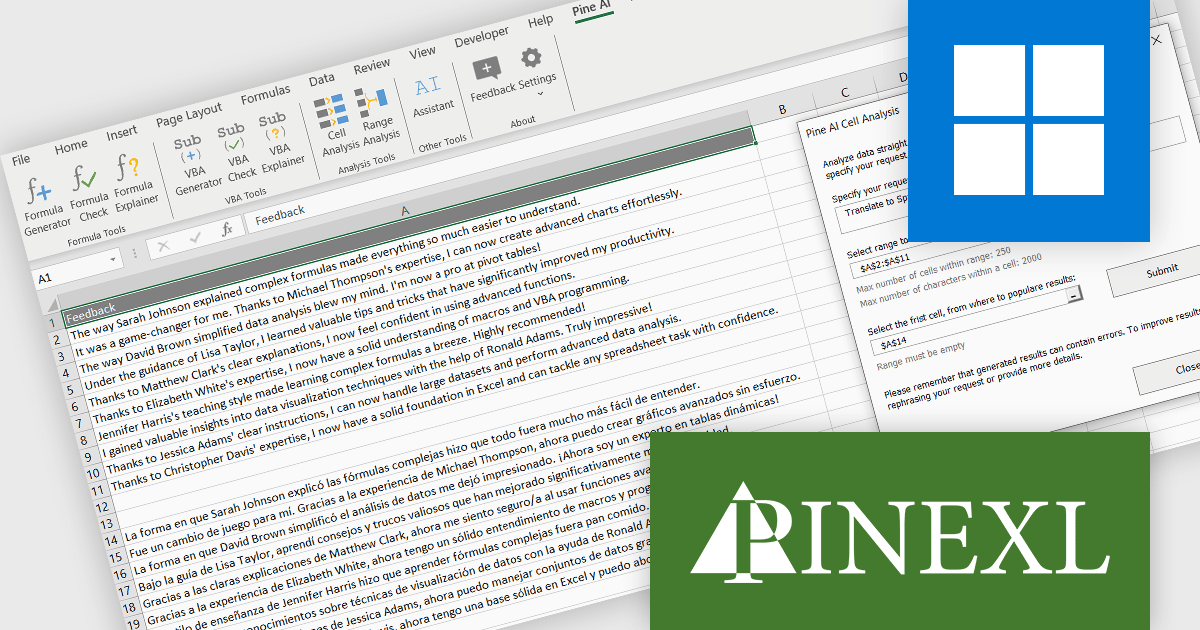
Pine AI Excel Add-In, developed by Pinexl, integrates OpenAI's ChatGPT into Microsoft Excel, enabling users to generate, debug, and interpret complex formulas and Visual Basic for Applications (VBA) code by simply describing their requirements. This tool enhances productivity by automating tasks such as data analysis, summarization, transformation, and translation directly within Excel spreadsheets. For instance, users can extract specific information from unstructured data, fill in missing details like country names based on city data, and translate text without leaving the Excel environment. By streamlining these processes, Pine AI reduces the time spent on manual data manipulation and extensive online research, making it a valuable asset for professionals seeking to optimize their workflow within Excel.
Using the Pine AI Excel Add-In, translating spreadsheet cell content is simple and seamless. Users can select the data they wish to translate directly within Excel, specify the target language, and let Pine AI handle the rest. The translated content is generated and placed back into the desired cells, maintaining the original format. This eliminates the need to use external tools, streamlining multilingual workflows and enhancing productivity for data analysis or global collaboration.
Pine AI Excel Add-In is licensed per user on an annual subscription basis. To continue using the software you will need an active subscription. See our Pine AI Excel Add-In licensing page for full details.
Learn more on our Pine AI Excel Add-In product page.
Tel: (888) 850 9911
Fax: +1 770 250 6199


