Fornecedor oficial
Como distribuidores oficiais e autorizados, nós fornecemos licenças legítimas diretamente de mais de 200 editores de software.
Ver todas as nossas marcas.
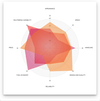
Descrição: Add Radar charts to your JavaScript apps. Vizuly Radar Chart graphs multiple dimensions of one ... This chart supports highlighting of both individual data points and the group as a whole. Features Supports ... Leia mais Mostrar mais resultados deste produto
Descrição: Adicione gráficos de Radar aos seus aplicativos JavaScript. Vizuly Radar Chart graphs multiple ... axis lines. This chart supports highlighting of both individual data points and the group as a whole. ... Leia mais
Preços: Vizuly Radar Chart 2.1.207 1 Developer License- includes 1 Year of Updates and Premium Support Our ... Leia mais
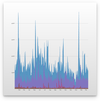
Descrição: Add line and area charts to your JavaScript apps. Vizuly Line Area Chart supports both line ... demonstrating the various chart properties and different style themes. You can either drop this component ... Leia mais Mostrar mais resultados deste produto
Preços: Vizuly Line Area Chart 2.1.207 1 Developer License- includes 1 Year of Updates and Premium Support ... Leia mais
Licenciamento: Vizuly Line Area Chart Licensing Leia mais
Descrição: Add stacked and clustered column charts to your JavaScript apps. Vizuly Column Chart supports both ... Leia mais Mostrar mais resultados deste produto
Preços: Vizuly Column Chart 2.1.207 1 Developer License- includes 1 Year of Updates and Premium Support ... Leia mais
Licenciamento: Vizuly Column Chart Licensing Leia mais

Descrição: Add stacked and clustered bar charts to your JavaScript apps. Vizuly Bar Chart supports both ... Leia mais Mostrar mais resultados deste produto
Preços: Vizuly Bar Chart 2.1.207 1 Developer License- includes 1 Year of Updates and Premium Support Our ... Leia mais
Licenciamento: Vizuly Bar Chart Licensing Leia mais
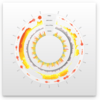
Descrição: Easily display multi-variate time series information. Vizuly Ring Chart lets you easily display ... and customized. In addition, the Ring Chart provides over 4 dozen customizable styles and a universal interaction ... Leia mais Mostrar mais resultados deste produto
Preços: Vizuly Ring Chart 2.1.207 1 Developer License- includes 1 Year of Updates and Premium Support Our ... Leia mais
Licenciamento: Vizuly Ring Chart Licensing Leia mais

Descrição: Add charts and visualizations to your JavaScript apps. Vizuly Professional includes Corona, Halo, ... Radial Bar, Ring Chart, Weighted Tree, Geo Plot, Bar Chart, Column Chart, Line Area Chart, Radar Chart ... Bar Ring Chart Weighted Tree Geo Plot (Beta) Bar Chart Column Chart Line Area Chart Radar Chart Radial ... Leia mais Mostrar mais resultados deste produto
Capturas de tela: 0 ... Leia mais
Capturas de tela: 0 ... Leia mais
Descrição: Add Venn Diagram charts to your JavaScript apps. Vizuly Venn Diagram shows all possible logical ... relations between a finite collection of different sets. This chart depicts elements as points in the plane, ... Leia mais Mostrar mais resultados deste produto
Descrição: possible logical relations between a finite collection of different sets. This chart depicts elements ... Leia mais
Capturas de tela: 0 ... Leia mais
Descrição: threshold. This chart supports a variable range of start/stop angles, arc end caps, and comes bundled ... Leia mais Mostrar mais resultados deste produto
Descrição: exceeded the maximum threshold. This chart supports a variable range of start/stop angles, arc end caps, ... Leia mais
Capturas de tela: 0 ... Leia mais

Descrição: A radial line and area layout visualization. Vizuly Corona is a radial chart that provides angular ... Leia mais Mostrar mais resultados deste produto
Descrição: Uma visualização de layout de linha e área radial. Vizuly Corona is a radial chart that provides ... Leia mais
Licenciamento: Vizuly Corona Licensing Leia mais

Descrição: in the middle of the chart. The length of each source arc is determined by a data bound variable you specify ... Leia mais Mostrar mais resultados deste produto
Descrição: middle of the chart. The length of each source arc is determined by a data bound variable you specify and ... Leia mais
Licenciamento: Vizuly Halo Licensing Leia mais