Fornecedor oficial
Como distribuidores oficiais e autorizados, nós fornecemos licenças legítimas diretamente de mais de 200 editores de software.
Ver todas as nossas marcas.

Descrição: Uma visualização de layout de linha e área radial. Vizuly Corona is a radial chart that provides angular and curved radial area line curves and supports both an overlap and stacked layout. It also features over a dozen different dynamic styles and comes bundled with an easy to use test container ... Leia mais Mostrar mais resultados deste produto
Descrição: A radial line and area layout visualization. Vizuly Corona is a radial chart that provides angular and curved radial area line curves and supports both an overlap and stacked layout. It also features over a dozen different dynamic styles and comes bundled with an easy to use test container that ... Leia mais
Compatibilidade: Tipo de componente JavaScript Reagir Angular Vue. js ... Leia mais

Descrição: data structure used by the Halo component is abstract enough that it can be adapted to many different ... Leia mais Mostrar mais resultados deste produto
Descrição: structure used by the Halo component is abstract enough that it can be adapted to many different data ... Leia mais
Compatibilidade: Tipo de componente JavaScript Reagir Angular Vue. js ... Leia mais

Descrição: Represente dados cartesianos x/y em um gráfico radial. Vizuly Radial Bar is designed to represent cartesian x/y data within a radial plot. It supports both clustered and stacked radial bars Use the interactive style explorer on the left to view different style settings, themes, and other ... Leia mais Mostrar mais resultados deste produto
Descrição: Represent cartesian x/y data within a radial plot. Vizuly Radial Bar is designed to represent cartesian x/y data within a radial plot. It supports both clustered and stacked radial bars Use the interactive style explorer on the left to view different style settings, themes, and other customizable ... Leia mais
Compatibilidade: Tipo de componente JavaScript Reagir Angular Vue. js ... Leia mais
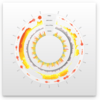
Descrição: Exiba facilmente informações de séries temporais multivariadas. Vizuly Ring Chart lets you easily display multi-variate time series information. Due to its radial form factor, you can display 3 times the information for a given screen width than you could with a more traditional cartesian layout. ... Leia mais Mostrar mais resultados deste produto
Descrição: Easily display multi-variate time series information. Vizuly Ring Chart lets you easily display multi-variate time series information. Due to its radial form factor, you can display 3 times the information for a given screen width than you could with a more traditional cartesian layout. You can ... Leia mais
Compatibilidade: Tipo de componente JavaScript Reagir Angular Vue. js ... Leia mais

Descrição: use this component directly into your application using its straightforward API, or use it ... Leia mais Mostrar mais resultados deste produto
Descrição: bundled with a test container and examples of different style based themes. You can use this component ... Leia mais
Compatibilidade: Tipo de componente JavaScript Reagir Angular Vue. js ... Leia mais

Descrição: use this component directly into your application using its straightforward API, or use it ... Leia mais Mostrar mais resultados deste produto
Descrição: bundled with a test container and examples of different style based themes. You can use this component ... Leia mais
Compatibilidade: Tipo de componente JavaScript Reagir Angular Vue. js ... Leia mais
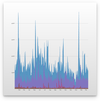
Descrição: component directly into your application using its straightforward API, or use it as a starting point ... Leia mais Mostrar mais resultados deste produto
Descrição: demonstrating the various chart properties and different style themes. You can either drop this component ... Leia mais
Compatibilidade: Tipo de componente JavaScript Reagir Angular Vue. js ... Leia mais
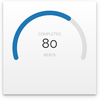
Descrição: Mostre valores numéricos dentro de um intervalo mínimo e máximo. Vizuly Radial Progress is designed to show numeric values within a minimum and maximum range. It can also show when a value has exceeded the maximum threshold. This chart supports a variable range of start/stop angles, arc end caps, ... Leia mais Mostrar mais resultados deste produto
Descrição: Show numeric values within a minimum and maximum range. Vizuly Radial Progress is designed to show numeric values within a minimum and maximum range. It can also show when a value has exceeded the maximum threshold. This chart supports a variable range of start/stop angles, arc end caps, and comes ... Leia mais
Compatibilidade: Tipo de componente JavaScript Reagir Angular Vue. js ... Leia mais
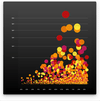
Descrição: Adicione gráficos de dispersão aos seus aplicativos JavaScript. Vizuly Scatter Plot shows 3 dimensions of data at once by plotting values along both the x and y axis as well as the radius of the plot itself. Each plot can be colored and styled dynamically based on your data. Features Supports ... Leia mais Mostrar mais resultados deste produto
Descrição: Add Scatter Plot charts to your JavaScript apps. Vizuly Scatter Plot shows 3 dimensions of data at once by plotting values along both the x and y axis as well as the radius of the plot itself. Each plot can be colored and styled dynamically based on your data. Features Supports Dynamic Scales for ... Leia mais
Compatibilidade: Tipo de componente JavaScript Reagir Angular Vue. js ... Leia mais
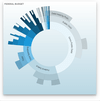
Descrição: Adiciona gráficos Sunburst aos seus aplicativos JavaScript. Vizuly Sunburst is designed to represent hierarchical data in a radial plot. It supports drill down and drill up capabilities by allowing the user to collapse and expand segments of the sunburst when they click on that area. Features ... Leia mais Mostrar mais resultados deste produto
Descrição: Adds Sunburst charts to your JavaScript apps. Vizuly Sunburst is designed to represent hierarchical data in a radial plot. It supports drill down and drill up capabilities by allowing the user to collapse and expand segments of the sunburst when they click on that area. Features Supports Dynamic ... Leia mais
Compatibilidade: Tipo de componente JavaScript Reagir Angular Vue. js ... Leia mais