


官方供应商
我们作为官方授权经销商,直接提供超过200家开发厂家所发行超过1000个的产品授权给您。
查看我们的所有品牌。
继续用英语阅读:
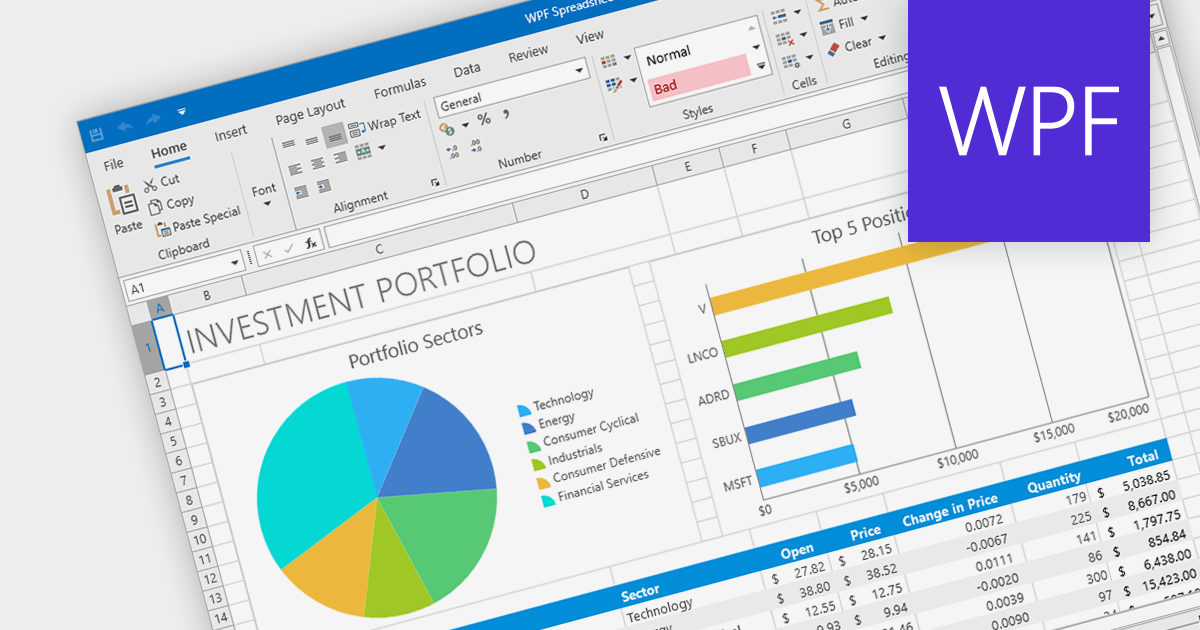
Charts are integral to spreadsheets, enabling users to transform data into visually compelling representations. These graphical formats, such as pie, line, bar, and area charts, effectively convey complex information by highlighting trends, patterns, and anomalies. Spreadsheet software with advanced charting capabilities empowers users to create dynamic charts that adapt seamlessly to data updates, making them invaluable tools for reporting, presentations, and data analysis.
Several .NET WPF spreadsheet components provide chart support including:
For an in-depth analysis of features and price, visit our comparison of .NET Spreadsheet components.
联系电话: (888) 850 9911
传真: +1 770 250 6199


