


官方供应商
我们作为官方授权经销商,直接提供超过200家开发厂家所发行超过1000个的产品授权给您。
查看我们的所有品牌。
继续用英语阅读:
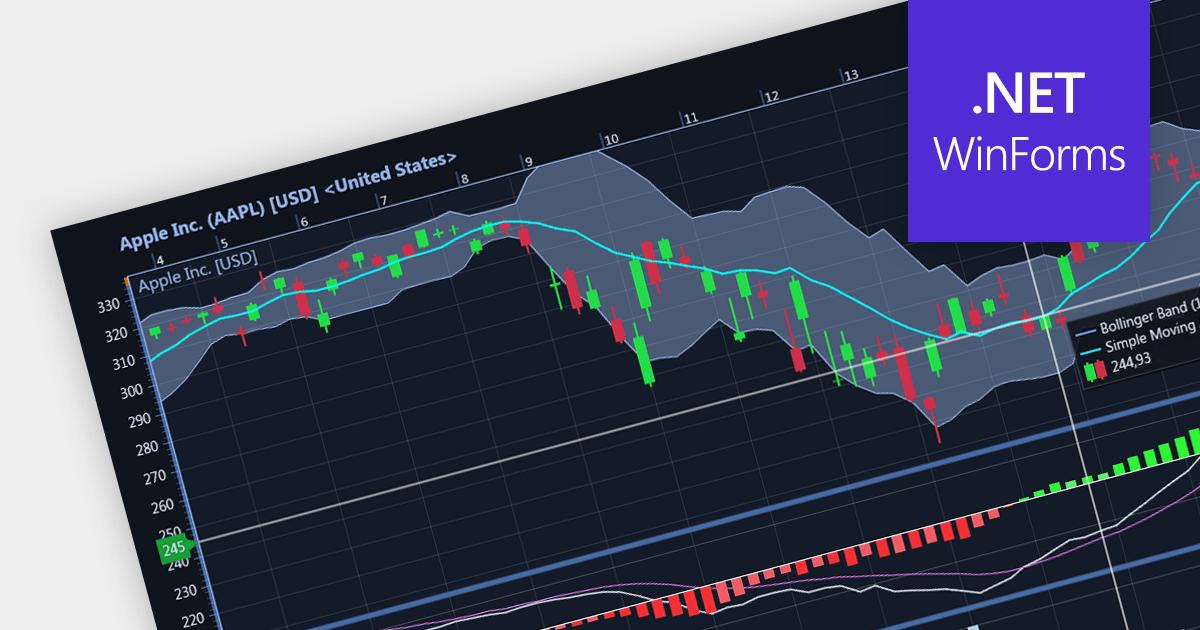
Candlestick charts are a style of financial chart used to describe price movements of a security, derivative, or currency. Each "candlestick" typically shows one day, with the central "box" representing the range between the opening and closing prices and the lines showing highs and lows. Their unique visual format helps traders to quickly understand market sentiment.
Several WinForms chart controls offer Candlestick charts including:
For an in-depth analysis of features and price, visit our WinForms chart controls comparison.
联系电话: (888) 850 9911
传真: +1 770 250 6199


