


官方供应商
我们作为官方授权经销商,直接提供超过200家开发厂家所发行超过1000个的产品授权给您。
查看我们的所有品牌。
继续用英语阅读:
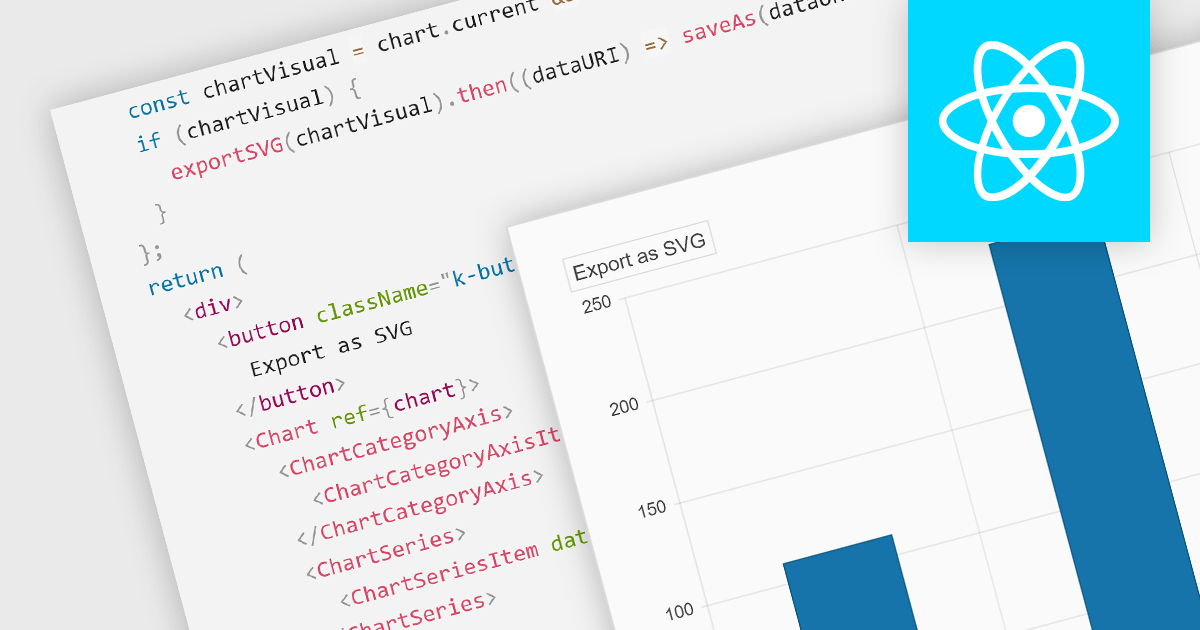
Exporting charts to SVG (Scalable Vector Graphics) format is vital for maintaining high-quality visuals in digital formats. SVGs are resolution-independent, meaning they retain their quality at any size, which is crucial for presentations or reports that might be viewed on different devices. This feature allows users to share their charts outside the chart creation tool while ensuring visual fidelity and sharpness.
Several React chart controls offer support for exporting to SVG including:
For an in-depth analysis of features and price, visit our React chart controls comparison.
联系电话: (888) 850 9911
传真: +1 770 250 6199


