


官方供应商
我们作为官方授权经销商,直接提供超过200家开发厂家所发行超过1000个的产品授权给您。
查看我们的所有品牌。
继续用英语阅读:
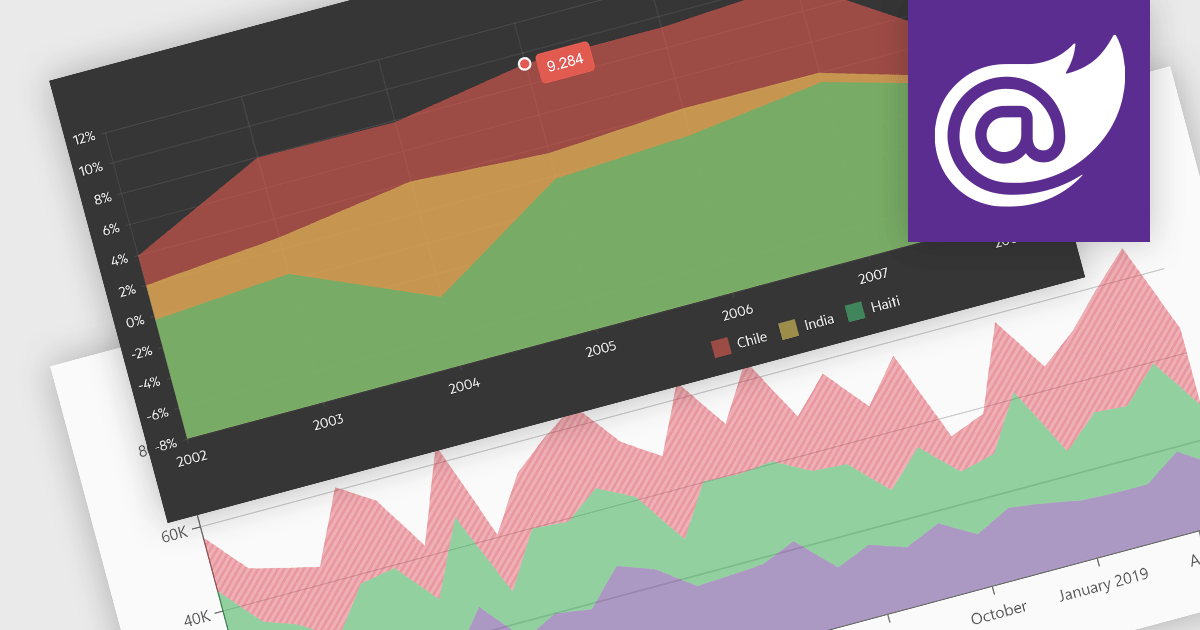
Area charts combine the strengths of line and bar charts, typically depicting how quantitative data changes over time. The area beneath the lines is shaded, emphasizing trends, comparisons between multiple data series, and the magnitude of change within each series. Ideal for showcasing cumulative totals and proportions, area charts excel in revealing trends and relationships within your data.
Several Blazor chart controls offer area charts including:
For an in-depth analysis of features and price, visit our Blazor chart controls comparison.
联系电话: (888) 850 9911
传真: +1 770 250 6199


