


官方供应商
我们作为官方授权经销商,直接提供超过200家开发厂家所发行超过1000个的产品授权给您。
查看我们的所有品牌。
继续用英语阅读:
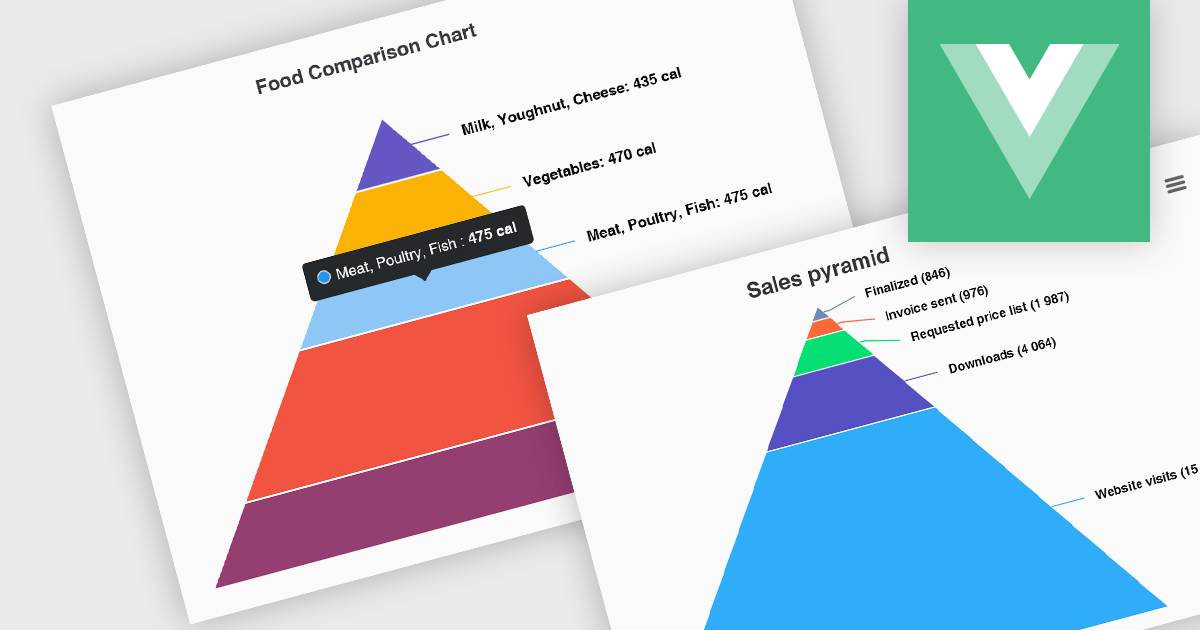
Pyramid charts, also known as triangle diagrams, utilize a triangular shape segmented into horizontal sections, each representing a level in a hierarchy, process, or simple dataset. Their strength lies in visually depicting hierarchical relationships, emphasizing the relative importance or size of each level through varying widths. The easily understood layout makes them ideal for communicating clear, singular data points in fields like sales funnels, population structures, and educational concepts.
Several Vue.js chart controls offer pyramid charts including:
For an in-depth analysis of features and price, visit our Vue.js chart controls comparison.
联系电话: (888) 850 9911
传真: +1 770 250 6199


