


官方供应商
我们作为官方授权经销商,直接提供超过200家开发厂家所发行超过1000个的产品授权给您。
查看我们的所有品牌。
继续用英语阅读:
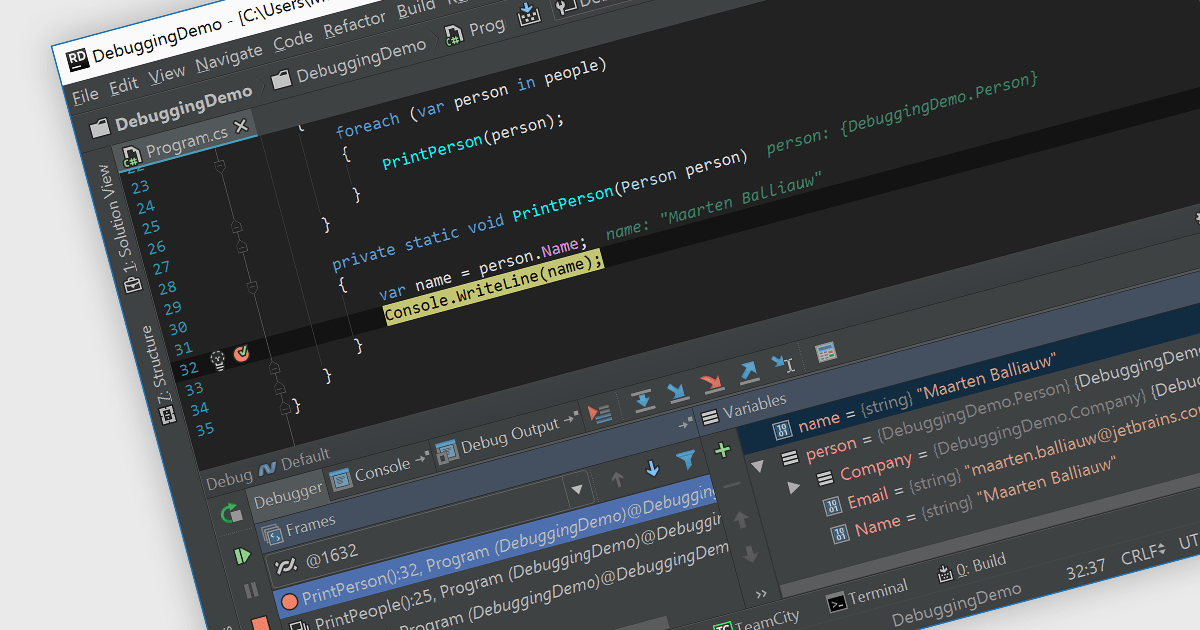
Debugging is the methodical process of identifying and rectifying errors or bugs within code. Many Integrated Development Environments (IDEs) provide a platform for debugging by allowing programmers to step through code execution line by line, examine variable values at specific points, and set breakpoints to pause execution at designated sections. This controlled environment empowers developers to easily pinpoint the cause of issues and implement fixes.
Several IDEs provide debugging including:
For an in-depth analysis of features and price, visit our IDEs comparison.
联系电话: (888) 850 9911
传真: +1 770 250 6199


