


官方供应商
我们作为官方授权经销商,直接提供超过200家开发厂家所发行超过1000个的产品授权给您。
查看我们的所有品牌。
继续用英语阅读:
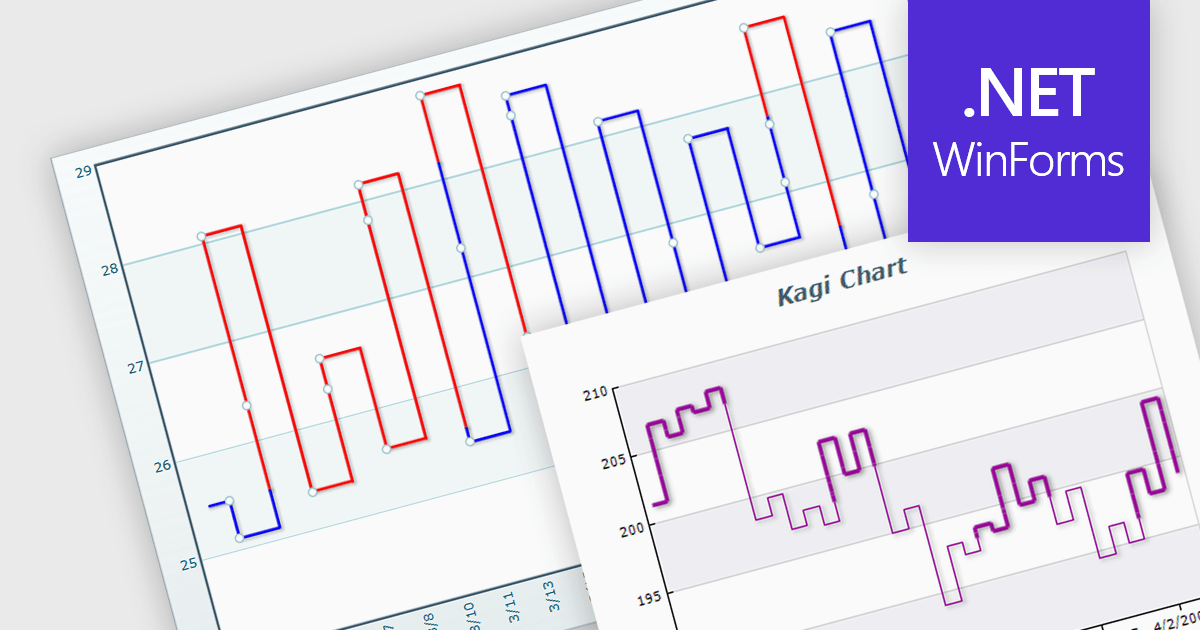
A Kagi chart is a type of financial chart used to track price movements, with a focus on significant trends and reversals rather than minor fluctuations, to inform stock purchasing decisions. It features a series of vertical lines that reflect changes in price. The direction of these lines shifts only when the price moves by a predetermined amount, known as the reversal amount. Thin lines indicate that the price has fallen below the previous low while thick lines indicate that the price has surpassed the previous high. By filtering out minor price fluctuations it emphasises substantial price movements, offering a clearer perspective on market trends.
Several WinForms chart components provide Kagi charts, including:
For an in-depth analysis of features and price, visit our WinForms charts comparison.
联系电话: (888) 850 9911
传真: +1 770 250 6199


