


官方供应商
我们作为官方授权经销商,直接提供超过200家开发厂家所发行超过1000个的产品授权给您。
查看我们的所有品牌。
继续用英语阅读:
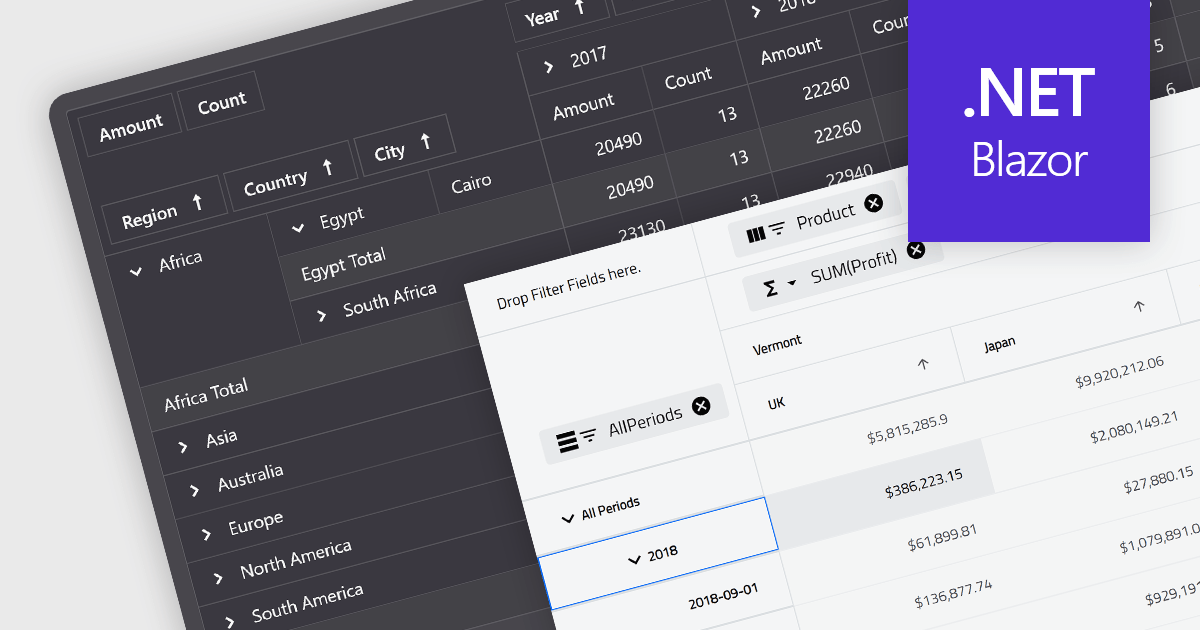
A pivot grid is a powerful data analysis tool that allows you to dynamically summarize and reorganize large datasets. By dragging and dropping fields, you can quickly create a new table that groups and calculates values based on different categories, revealing trends and patterns within your data. This interactive functionality makes pivot grids ideal for gaining insights and informing data-driven decisions. Common use cases include financial analysis, marketing campaign evaluation, and sales performance exploration.
Several Blazor UI suites feature a pivot grid control including:
For an in-depth analysis of features and price, visit our Blazor UI suites comparison.
联系电话: (888) 850 9911
传真: +1 770 250 6199


