


官方供应商
我们作为官方授权经销商,直接提供超过200家开发厂家所发行超过1000个的产品授权给您。
查看我们的所有品牌。
继续用英语阅读:
Stimulsoft Reports.JS provides a robust reporting toolkit designed specifically for JavaScript applications. This library leverages a client-side architecture, offering a pure JavaScript report engine for efficient report rendering directly within web browsers. The solution includes a user-friendly report designer for building reports with various data sources and visualizations, along with a report viewer for seamless integration and display within your JavaScript applications. This eliminates the need for server-side dependencies or browser plugins, simplifying the development process for embedding powerful reporting functionalities into your web projects.
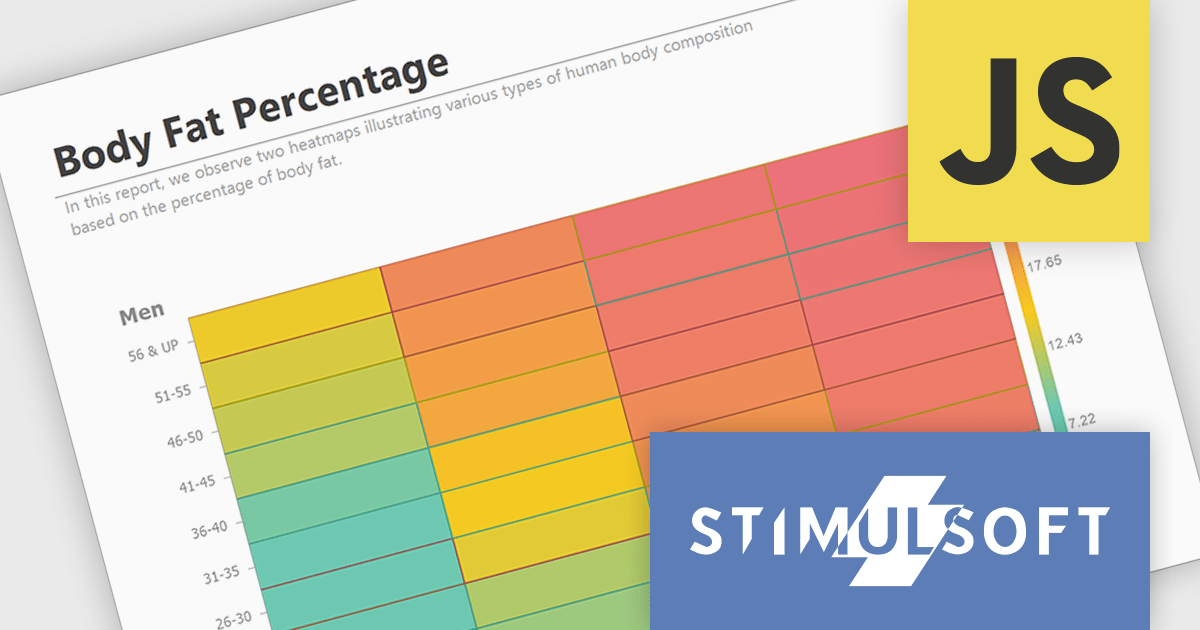
The Stimulsoft Reports.JS 2024.3 update adds a powerful new data visualization tool: the heatmap chart. This intuitive chart type excels at revealing patterns and trends within large datasets. By visually encoding data values through color gradients, heatmaps simplify complex information, allowing users to quickly identify areas of high, medium and low concentration. Stimulsoft Reports.JS seamlessly integrates heatmaps into your existing reporting workflows, enhancing data exploration and communication for your users.
To see a full list of what's new in version 2024.3, see our release notes.
Stimulsoft Reports.JS is licensed per developer and is available as a Perpetual license with 1 year support and maintenance. See our Stimulsoft Reports.JS licensing page for full details.
Stimulsoft Reports.JS is available in the following products:
联系电话: (888) 850 9911
传真: +1 770 250 6199


