


官方供应商
我们作为官方授权经销商,直接提供超过200家开发厂家所发行超过1000个的产品授权给您。
查看我们的所有品牌。
继续用英语阅读:
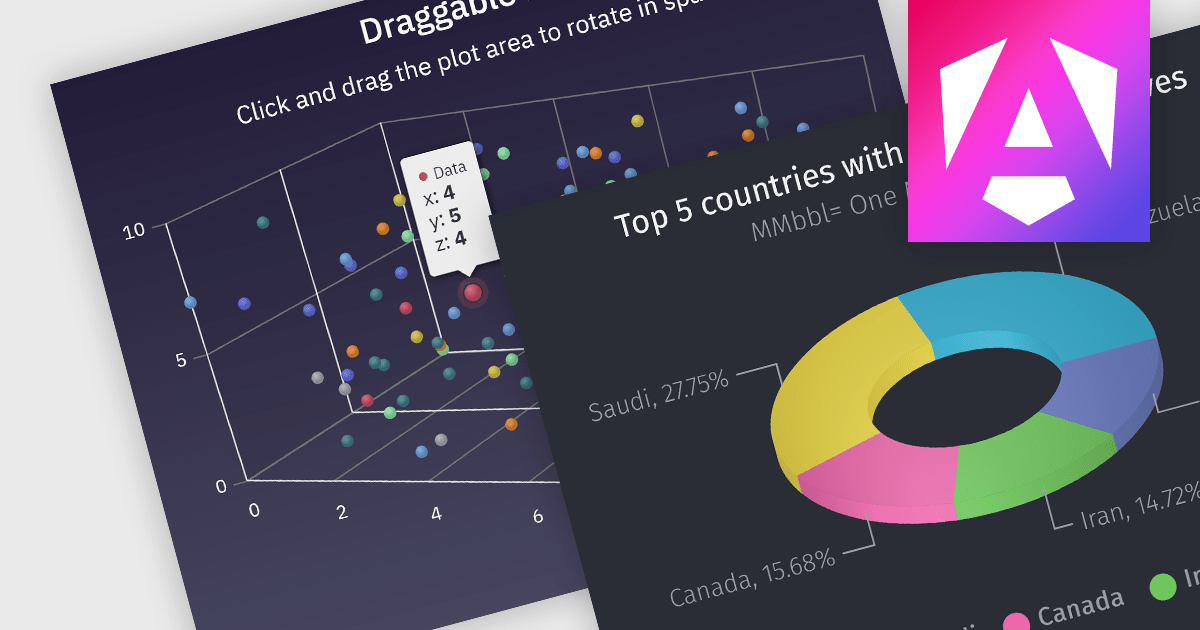
3D charts allow data visualization with depth along a third axis. This capability goes beyond traditional 2D charts, offering a more immersive and informative view. 3D charts are particularly beneficial for complex datasets with multiple variables, as they can reveal patterns and relationships that might be obscured in a flat format. Use cases include showcasing product sales across regions and demographics, visualizing financial trends over time, or depicting scientific data with multiple dimensions.
Several Angular chart controls offer 3D charts including:
For an in-depth analysis of features and price, visit our comparison of Angular chart controls.
联系电话: (888) 850 9911
传真: +1 770 250 6199


