


官方供应商
我们作为官方授权经销商,直接提供超过200家开发厂家所发行超过1000个的产品授权给您。
查看我们的所有品牌。
继续用英语阅读:
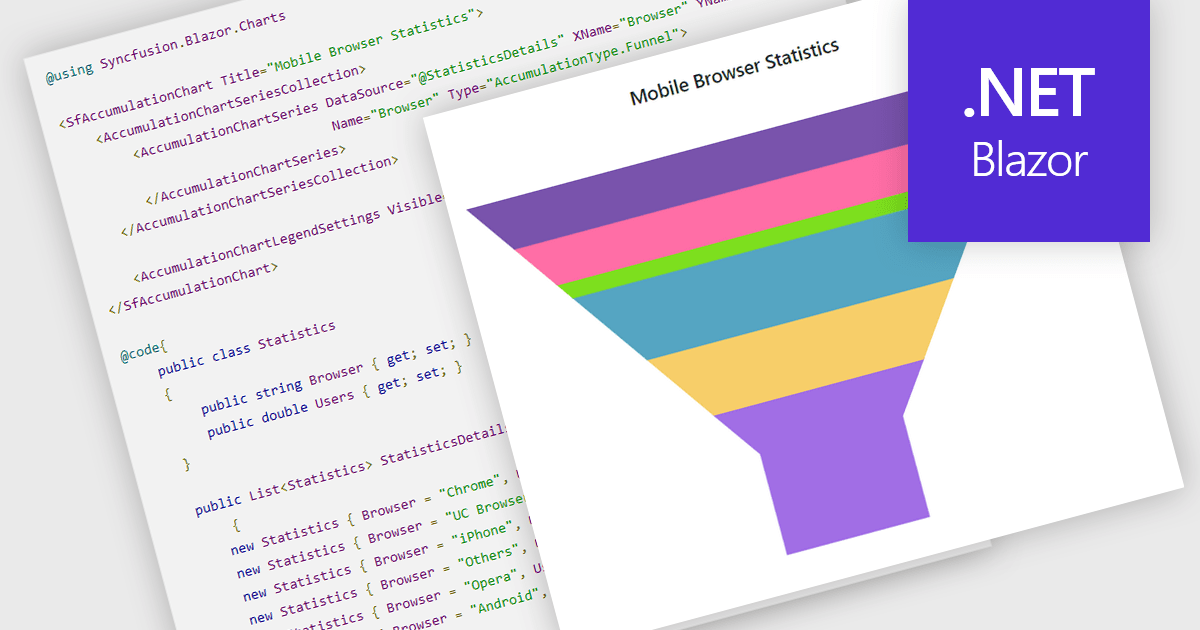
Funnel charts are a type of data visualization that depicts data in a linear process that often narrows down at each stage, resembling a funnel. They are especially useful for emphasizing steps in a process, displaying drop-off rates, and finding bottlenecks in workflows. Funnel charts are useful because they visually show the continual reduction of data throughout phases, providing clear insights into conversion rates and process efficiency. This enables engineers and business analysts to quickly find areas for improvement, optimize procedures, and create more accurate data-driven decisions.
Several .NET Blazor chart controls offer funnel charts including:
For an in-depth analysis of features and price, visit our .NET Blazor chart controls comparison.
联系电话: (888) 850 9911
传真: +1 770 250 6199


