


官方供应商
我们作为官方授权经销商,直接提供超过200家开发厂家所发行超过1000个的产品授权给您。
查看我们的所有品牌。
继续用英语阅读:
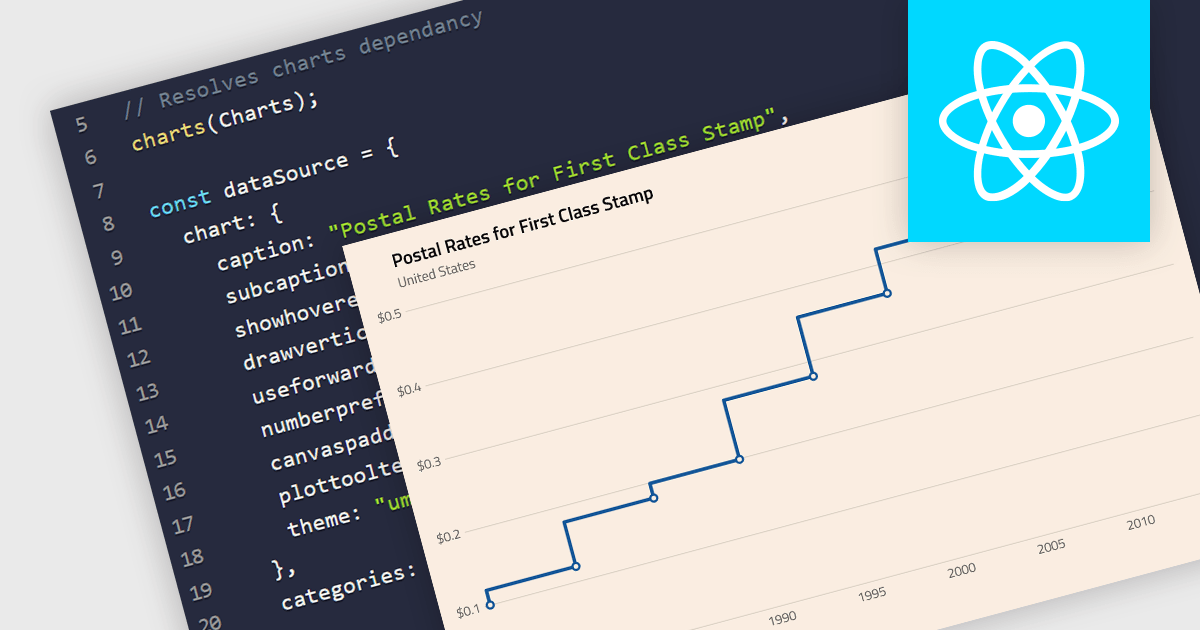
A step line chart is a type of data visualization that displays data points connected by horizontal and vertical line segments, forming a step-like appearance. Unlike traditional line charts that emphasize continuous trends, step line charts highlight changes that occur at irregular intervals and are for depicting data that changes at specific points in time. This makes them particularly effective for representing data that undergoes discrete shifts, such as inventory levels, interest rates, or monitoring server performance, where the exact timing and magnitude of changes are crucial to understand. By clearly showing these transitions, these charts provide precise insights into the timing and impact of changes, aiding in more accurate decision-making and analysis.
Several React chart components support the step line chart type, including:
For an in-depth analysis of features and price, visit our comparison of React chart components.
联系电话: (888) 850 9911
传真: +1 770 250 6199


