


官方供应商
我们作为官方授权经销商,直接提供超过200家开发厂家所发行超过1000个的产品授权给您。
查看我们的所有品牌。
继续用英语阅读:
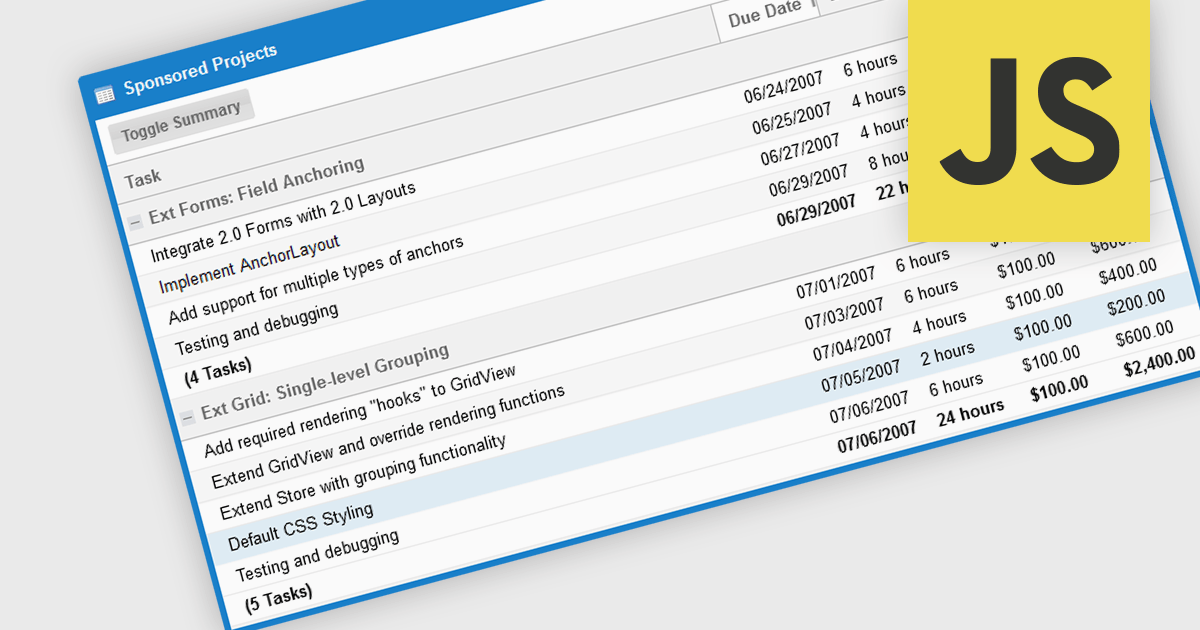
The grouping/summary feature in grid controls enables users to categorize and analyze data effectively by grouping rows based on specific criteria. This functionality allows for the aggregation of data within each group, providing valuable summaries such as totals, averages, counts, and more. By organizing information in a more structured manner, users can gain deeper insights into trends, patterns, and outliers within their data. This feature is particularly useful for large datasets, financial reporting, and data analysis tasks that require a high level of customization and flexibility.
Several JavaScript Grid controls offer grouping / summary support including:
For an in-depth analysis of features and price, visit our comparison of JavaScript grid controls.
联系电话: (888) 850 9911
传真: +1 770 250 6199


