


官方供应商
我们作为官方授权经销商,直接提供超过200家开发厂家所发行超过1000个的产品授权给您。
查看我们的所有品牌。
继续用英语阅读:
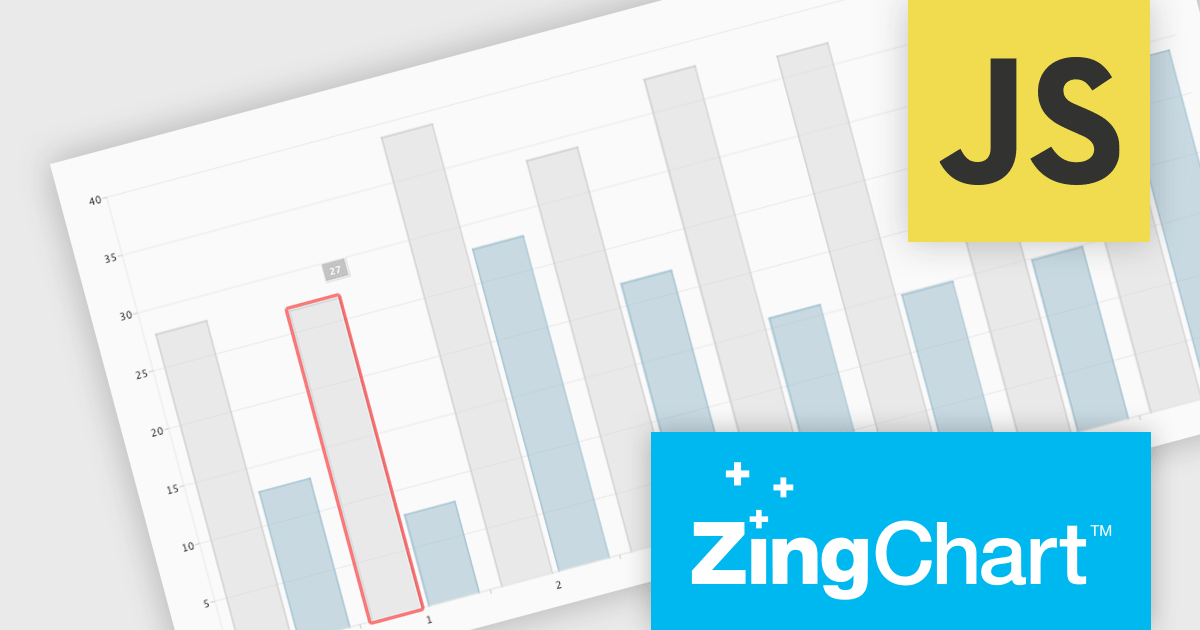
ZingChart is a powerful data visualization tool that empowers businesses to transform raw data into actionable insights. With its extensive library of customizable charts and graphs, ZingChart allows users to create visually stunning and interactive visualizations. Key features include real-time updates, data binding, and integration with popular programming languages and frameworks. By leveraging ZingChart, organizations can gain deeper understanding of their data, identify trends, and make data-driven decisions to improve efficiency and achieve business objectives.
The ZingChart 2.9.15 release improves inclusivity and accessibility. With the addition of robust keyboard navigation and speech support, users can now interact with charts effortlessly, regardless of their visual or motor abilities. By simply using their keyboard or screen reader, individuals can explore, analyze, and understand data visualization elements with ease. This significant enhancement ensures that ZingChart is a valuable tool for everyone, promoting inclusivity and accessibility in data visualization.
To see a full list of what's new in 2.9.15, see our release notes.
ZingChart is licensed on an annual or perpetual basis. It has several license options including Website, Internal, Service (SaaS), Enterprise and OEM. See our ZingChart licensing page for full details.
Learn more on our ZingChart product page.
联系电话: (888) 850 9911
传真: +1 770 250 6199


