


官方供应商
我们作为官方授权经销商,直接提供超过200家开发厂家所发行超过1000个的产品授权给您。
查看我们的所有品牌。
继续用英语阅读:
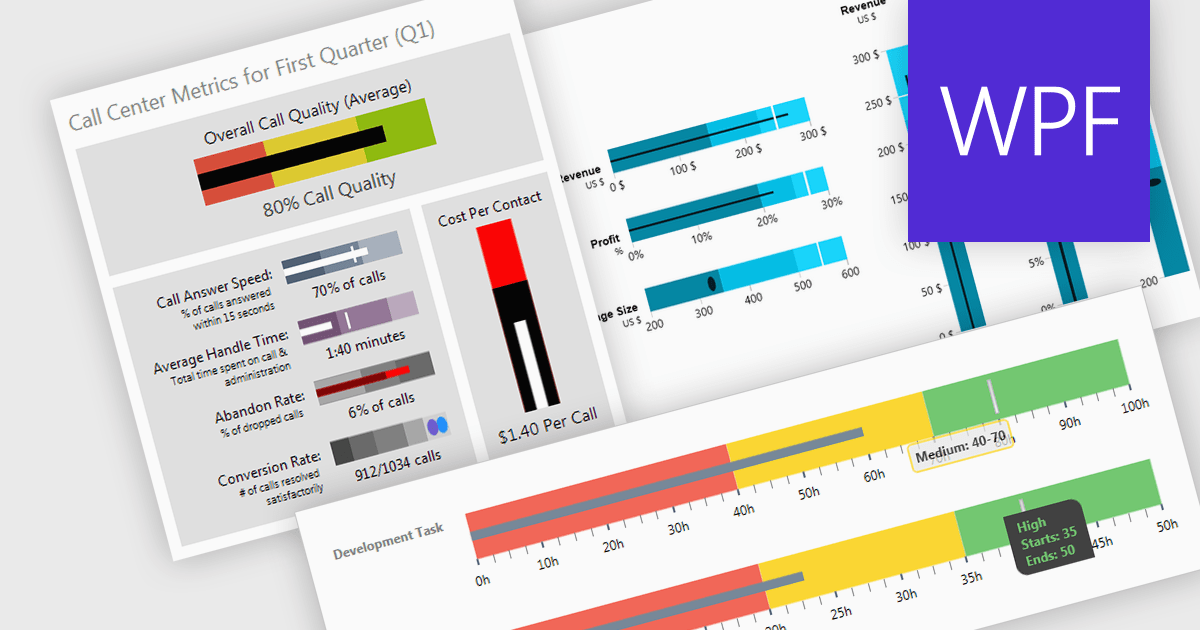
A bullet chart (or bullet graph) is a streamlined bar chart that effectively conveys key performance metrics in relation to targets. It features a single bar representing the main value, overlaid with shaded regions indicating qualitative ranges (e.g., "poor," "average," "good"), and a line marking the target. This minimalist design offers a clear, at-a-glance assessment of performance, making it well-suited for dashboards and reports where space is limited and focus on essential metrics is paramount.
Several WPF charting components support bullet graphs:
For an in-depth analysis of features and price, visit our comparison of WPF charting components.
联系电话: (888) 850 9911
传真: +1 770 250 6199


