


官方供应商
我们作为官方授权经销商,直接提供超过200家开发厂家所发行超过1000个的产品授权给您。
查看我们的所有品牌。
继续用英语阅读:
Stimulsoft Dashboards.PYTHON is a new data visualization tool specifically designed for building interactive dashboards within Python applications. It combines a client-side JavaScript engine for data processing with a designer component to craft dashboards and a viewer for displaying them. This empowers developers to create clear and informative visual representations of data directly within their Python projects.
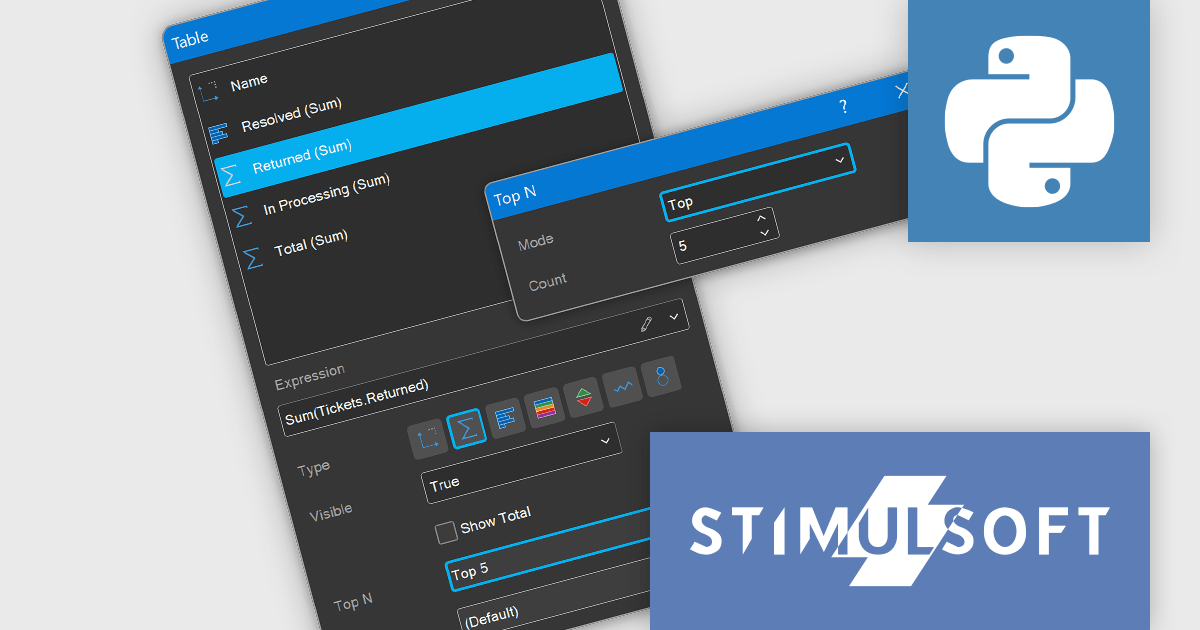
The Stimulsoft Dashboards.PYTHON 2024.4.1 release adds the ability to display the best values for Measure fields in the Table and Cards dashboard elements. Users can now easily identify and visualize the most relevant or extreme values within their datasets. By specifying the desired number of top or bottom values, users can focus on critical information and gain valuable insights more efficiently.
To see a full list of what's new in 2024.4.1, see our release notes.
Stimulsoft Dashboards.PYTHON is licensed per developer and is available as a perpetual license with 1 year support and maintenance. See our Stimulsoft Dashboards.PYTHON licensing page for full details.
Stimulsoft Dashboards.PYTHON is available in the following products:
联系电话: (888) 850 9911
传真: +1 770 250 6199


