


官方供应商
我们作为官方授权经销商,直接提供超过200家开发厂家所发行超过1000个的产品授权给您。
查看我们的所有品牌。
继续用英语阅读:
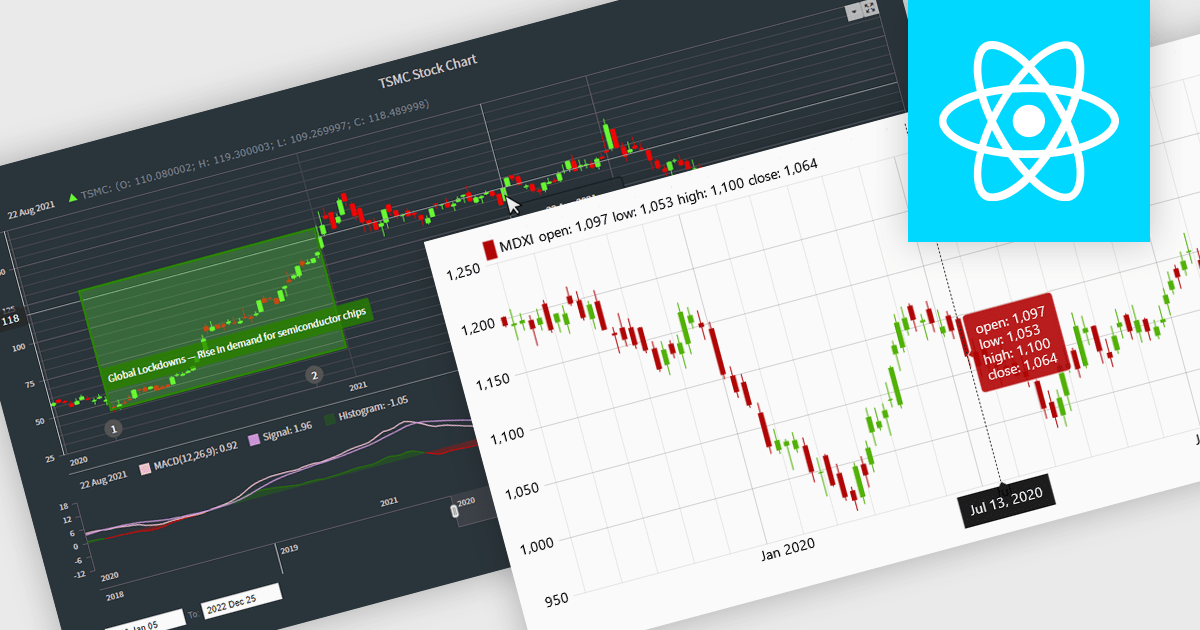
Candlestick charts are a powerful data visualization tool used to represent price movements within a specific time frame, displaying the opening, closing, high, and low prices in a single, compact graphical format. For software developers, integrating candlestick charts into applications enables users to analyze market trends, identify potential reversals, and make informed decisions with precise, actionable data. These charts are adaptable across various time frames, work seamlessly with technical indicators, and offer a clear visual representation that aids in interpreting complex financial data efficiently, making them an essential feature in trading platforms and analytics tools.
Several React chart controls offer candlestick chart support including:
For an in-depth analysis of features and price, visit our React chart controls comparison.
联系电话: (888) 850 9911
传真: +1 770 250 6199


