


官方供应商
我们作为官方授权经销商,直接提供超过200家开发厂家所发行超过1000个的产品授权给您。
查看我们的所有品牌。
继续用英语阅读:
LightningChart JS is a JavaScript/TypeScript library developed by LightningChart that is particularly well-suited for data-intensive visualizations, offering exceptionally fast rendering capabilities thanks to its use of WebGL. This makes it a strong choice for applications that require real-time data updates, such as financial platforms, engineering tools, scientific research dashboards, and industrial monitoring systems. It provides high-performance, 2D, 3D, and real-time charting controls and a comprehensive suite of visualizations including candlestick, bar, line, and various technical indicators and drawing tools. This library enables software developers to craft interactive technical analysis tools without the need for server-side setup as it runs completely on the client device.
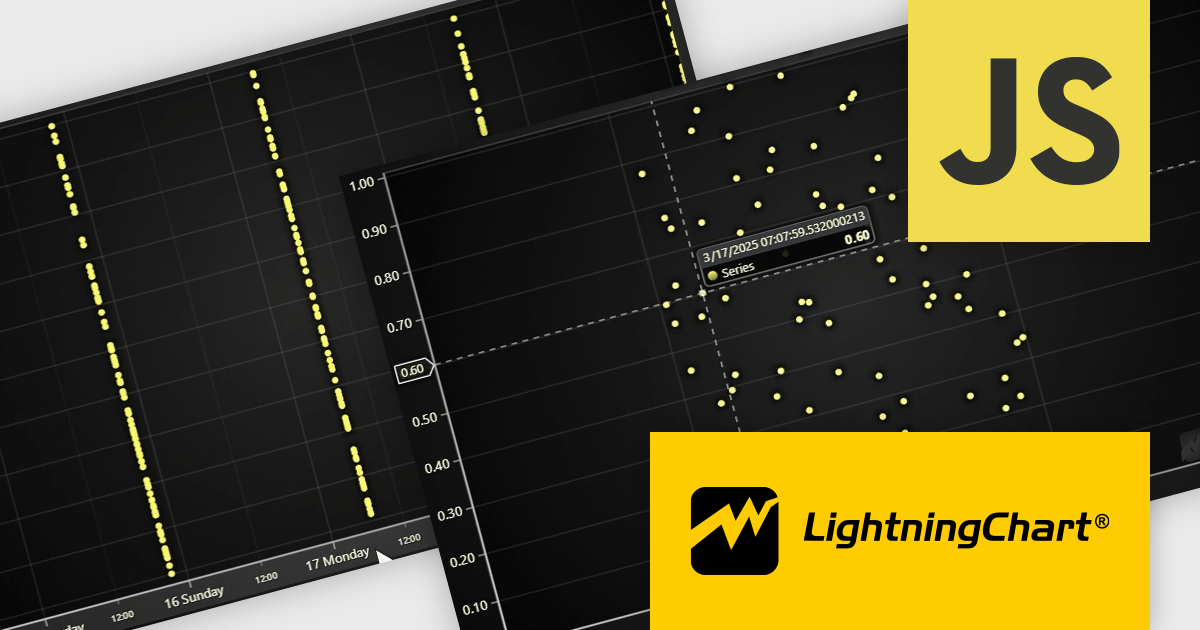
The LightningChart JS v7.1 update enhances its Date-Time axis capabilities by introducing support for nanosecond-resolution timestamps, allowing users to zoom into microsecond and nanosecond ranges for more granular time-based data analysis—well beyond the previous millisecond limitations. To utilize this feature, timestamps should generally be supplied as BigInt64. This update positions LightningChart JS among the few web charting libraries explicitly supporting nanosecond precision, making it a strong choice for applications requiring high-resolution temporal data visualization.
To see a full list of what's new in v7.1, see our release notes.
LightningChart JS is licensed per developer and is available as an annual license with 1 year support. See our LightningChart JS licensing page for full details.
For more information, see our LightningChart JS product page.
联系电话: (888) 850 9911
传真: +1 770 250 6199


