


官方供应商
我们作为官方授权经销商,直接提供超过200家开发厂家所发行超过1000个的产品授权给您。
查看我们的所有品牌。
继续用英语阅读:
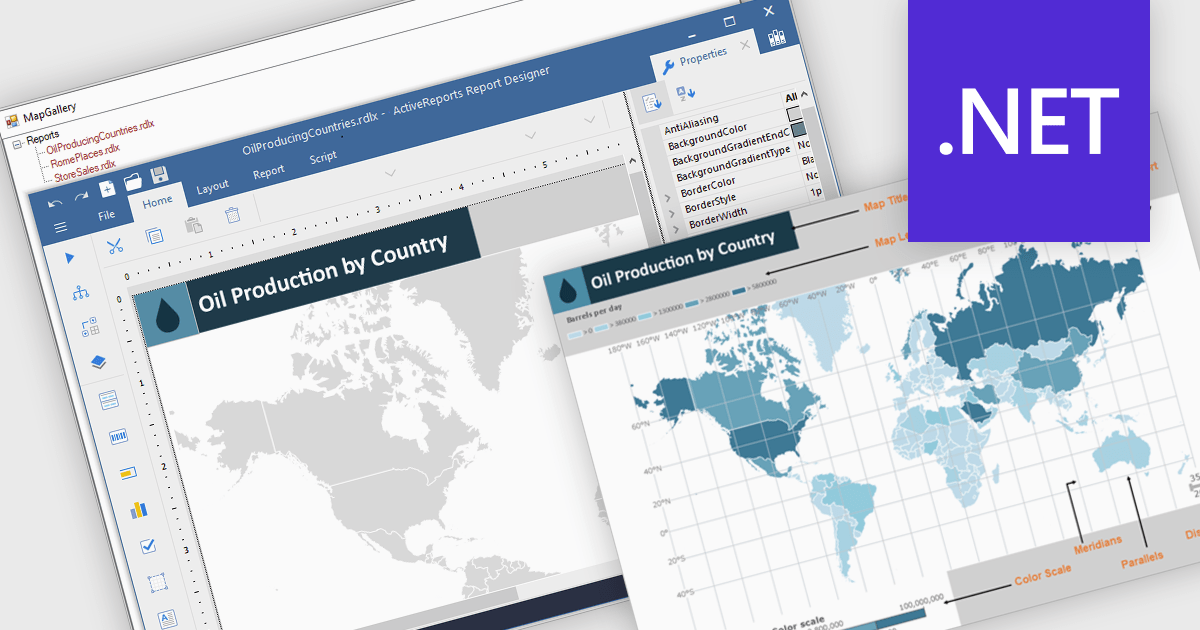
Maps in reports are visual tools that display geographic data, allowing users to see where activities, trends, or values occur across specific regions. By translating complex location-based information into clear and intuitive visuals, maps enhance understanding, highlight spatial patterns, and reveal insights that might be missed in tables or charts. This added layer of geographic context supports more informed decision-making and more compelling data storytelling. Common use cases include tracking regional sales performance, mapping customer distribution, analyzing service coverage, and presenting market expansion opportunities. Whether static or interactive, maps make reports more engaging and impactful for both technical and non-technical audiences.
Several .NET reporting controls offer maps, including:
For an in-depth analysis of features and price, visit our comparison of .NET reporting controls.
联系电话: (888) 850 9911
传真: +1 770 250 6199


