


官方供应商
我们作为官方授权经销商,直接提供超过200家开发厂家所发行超过1000个的产品授权给您。
查看我们的所有品牌。
继续用英语阅读:
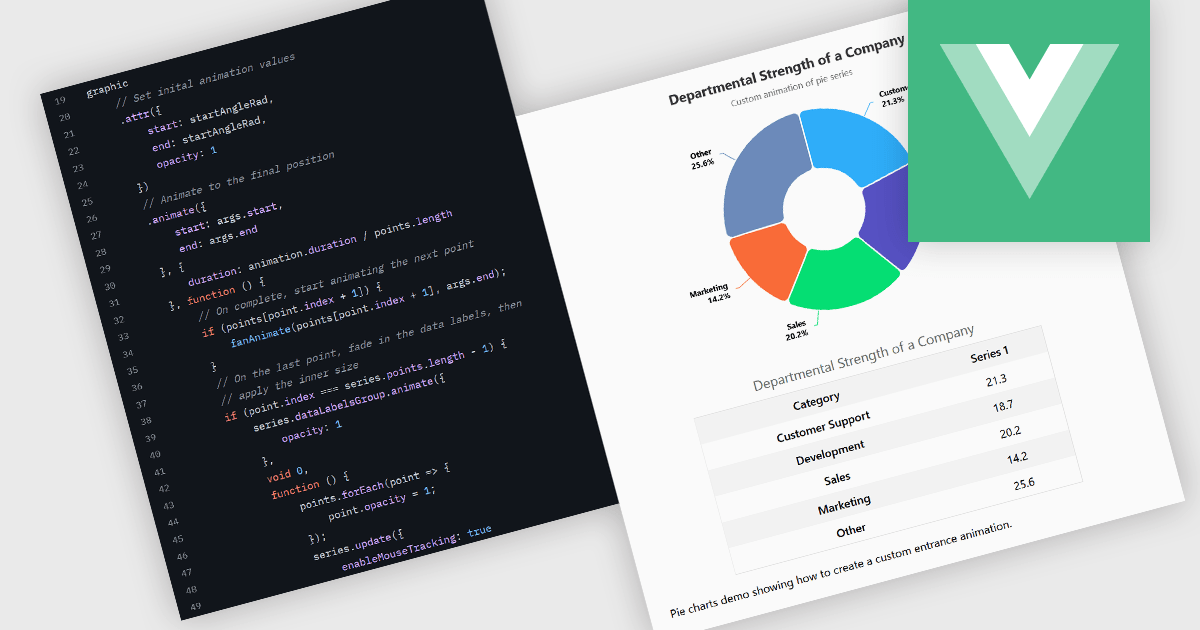
Animation in charts is a feature used in data visualization to visually transition between different data states or configurations. This technique helps communicate changes in data over time or between user interactions in a smooth, progressive manner. Rather than instantly switching from one state to another, animation introduces motion that can guide users’ attention, reinforce patterns, and reduce confusion. It is particularly useful in interactive dashboards and real-time analytics, where users benefit from a clearer understanding of what has changed and how.
Several Vue.js charting components support the use of animations, including:
For an in-depth analysis of features and price, visit our comparison of Vue.js chart components.
联系电话: (888) 850 9911
传真: +1 770 250 6199


