


官方供应商
我们作为官方授权经销商,直接提供超过200家开发厂家所发行超过1000个的产品授权给您。
查看我们的所有品牌。
继续用英语阅读:
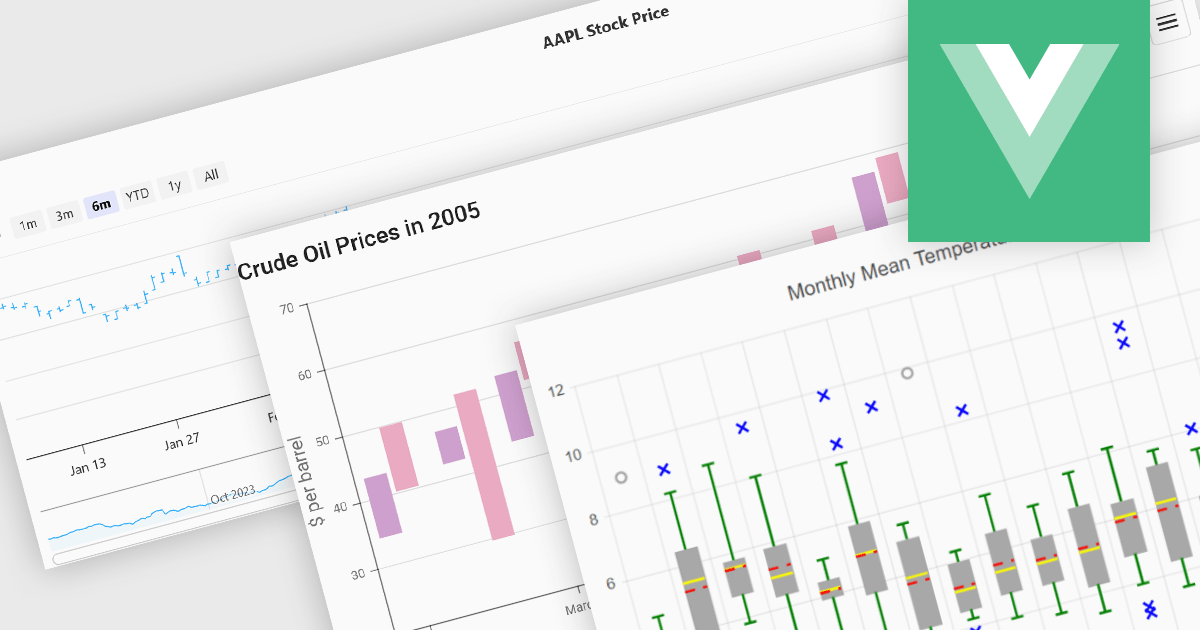
Financial chart components are used within software applications to visually represent complex financial data over time. They enable users, particularly those in trading, investment, and financial analysis, to interpret trends, compare performance, and make data-driven decisions more effectively. These components typically support a variety of chart types tailored to the unique requirements of financial datasets, allowing for granular analysis of price movements, market trends, and volatility.
Common features include:
For an in-depth analysis of features and price, visit our Vue.js Chart components comparison.
联系电话: (888) 850 9911
传真: +1 770 250 6199


