


官方供应商
我们作为官方授权经销商,直接提供超过200家开发厂家所发行超过1000个的产品授权给您。
查看我们的所有品牌。
继续用英语阅读:
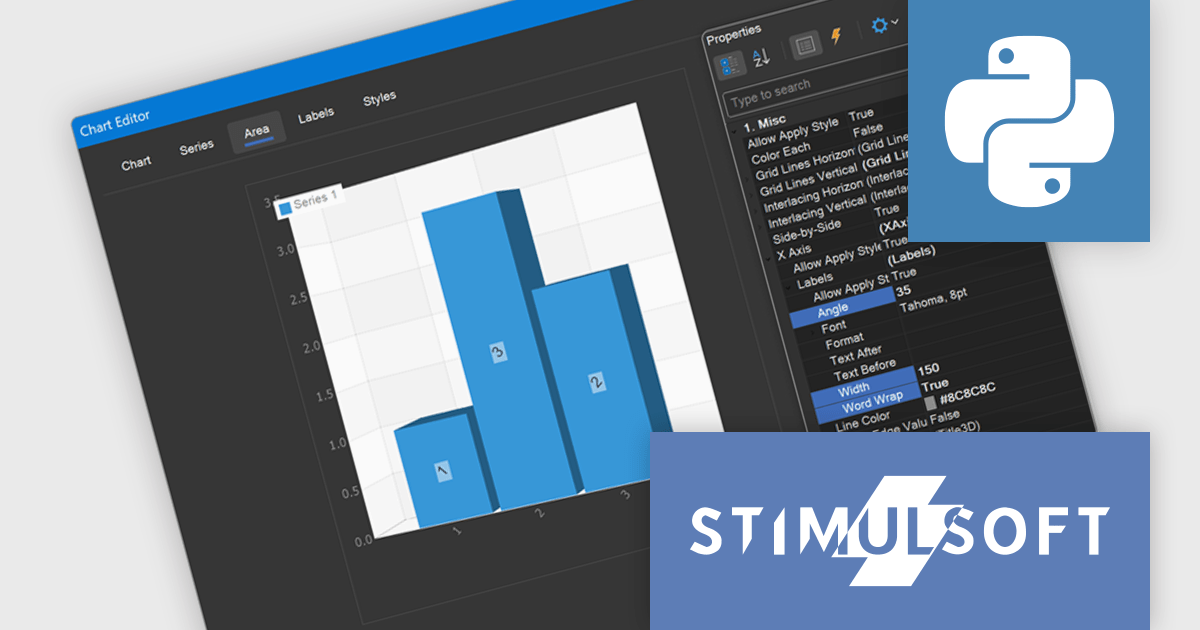
Stimulsoft Dashboards.PYTHON is a data visualization tool specifically designed for building interactive dashboards within Python applications. It combines a client-side JavaScript engine for data processing with a designer component to craft dashboards and a viewer for displaying them. This empowers developers to create clear and informative visual representations of data directly within their Python projects.
The Stimulsoft Dashboards.PYTHON 2025.3.1 update enhances 3D chart usability by introducing new axis label settings that improve how labels are displayed in complex data visualizations. Developers can now rotate labels to align with chart angles, define a maximum width to prevent overlap, and enable word wrap to maintain readability in constrained spaces. These additions provide greater control over chart formatting, allowing for clearer presentation of axis data, especially in dashboards with dense or multilingual content.
To see a full list of what's new in 2025.3.1, see our release notes.
Stimulsoft Dashboards.PYTHON is licensed per developer and is available as a perpetual license with 1 year support and maintenance. See our Stimulsoft Dashboards.PYTHON licensing page for full details.
Stimulsoft Dashboards.PYTHON is available individually or as part of Stimulsoft Ultimate.
联系电话: (888) 850 9911
传真: +1 770 250 6199


