将原始数据转化为清晰的见解

10月 7, 2025
借助排序、分组和计算功能,电子表格可以将大型数据集转换为结构化、有意义且有用的信息。

继续用英语阅读:

Data organization and analysis features form the backbone of a spreadsheet’s ability to transform raw inputs into meaningful insights. These capabilities go beyond simple data entry, providing the tools necessary to structure, manipulate, and interpret information effectively. By supporting both everyday tasks and complex analytical processes, they enable users to manage datasets of varying scale and complexity while ensuring that information remains accessible and actionable. Well-implemented organization and analysis features allow spreadsheets to serve not only as data storage tools but also as powerful environments for decision-making and reporting.

Common features include:

  • Sorting lets users arrange data in ascending or descending order to quickly identify patterns or prioritize information.
  • Data Filtering and Grouping allow specific subsets of data to be displayed or collapsed, improving clarity when working with large datasets.
  • Pivot Tables provide a dynamic way to summarize and analyze data, enabling multidimensional views without altering the original dataset.
  • Cross-Worksheet Calculations extend analytical capabilities by linking values across multiple sheets, supporting more integrated and comprehensive models.
  • Formula / Function Support offers the computational foundation of spreadsheets, with a wide range of built-in functions for mathematical, logical, and statistical operations.
  • Table Support gives structure to related rows and columns, adding features such as auto-expansion and easier formula referencing.
  • Sparklines deliver compact, cell-level charts that provide immediate visual context to numeric trends without the need for larger, standalone charts.

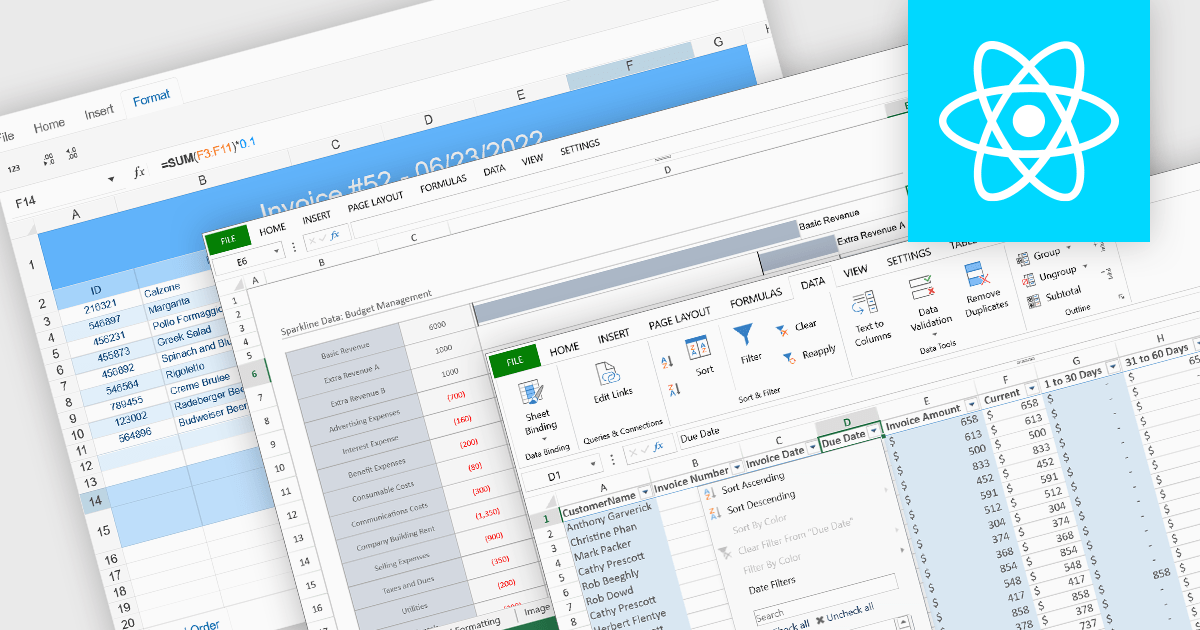
For an in-depth analysis of features and price, visit our React spreadsheet components comparison.

Explore React Spreadsheet Features