


官方供应商
我们作为官方授权经销商,直接提供超过200家开发厂家所发行超过1000个的产品授权给您。
查看我们的所有品牌。
继续用英语阅读:
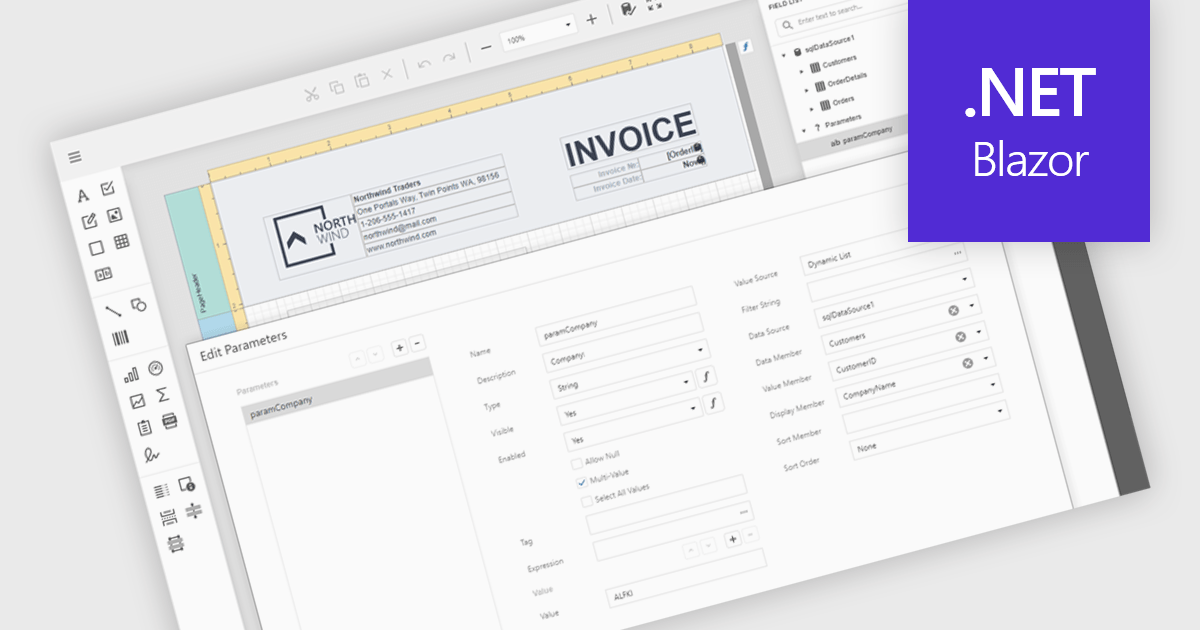
Data filtering and grouping in reporting help users organize and analyze information more efficiently by showing only the data that matters most. Filtering refines report results based on specific criteria such as date, category, or value, while grouping arranges related data into clear sections for easier comparison. Together, they improve clarity, speed up analysis, and reveal meaningful patterns. For example, a sales manager can view current quarter transactions grouped by region, or a finance team can review expenses filtered by department for more accurate insights.
Several .NET Blazor reporting controls offer data filtering and grouping including:
For an in-depth analysis of features and price, visit our comparison of .NET Blazor Reporting Controls.
联系电话: (888) 850 9911
传真: +1 770 250 6199


