


官方供应商
我们作为官方授权经销商,直接提供超过200家开发厂家所发行超过1000个的产品授权给您。
查看我们的所有品牌。
继续用英语阅读:
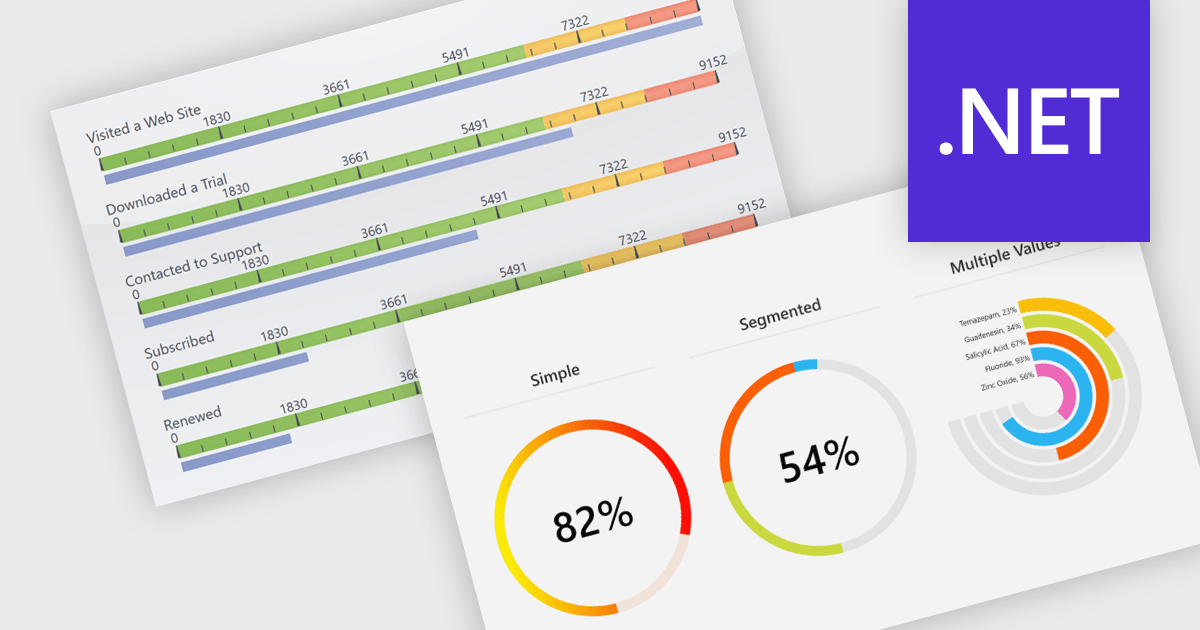
Gauges are specialized charting components used to visually display numerical values within a predefined range, often in formats such as radial, linear, or digital meters. They are commonly found in dashboards and monitoring tools, where their primary function is to provide immediate visual feedback on performance indicators or system metrics. Gauges are particularly useful for clearly communicating real-time data, allowing users to quickly assess the current state of a metric to determine whether a value is within acceptable limits or requires attention.
Several .NET charting components also offer gauges, including:
For an in-depth analysis of features and price, visit our comparison of .NET chart components.
联系电话: (888) 850 9911
传真: +1 770 250 6199


