


官方供应商
我们作为官方授权经销商,直接提供超过200家开发厂家所发行超过1000个的产品授权给您。
查看我们的所有品牌。
继续用英语阅读:
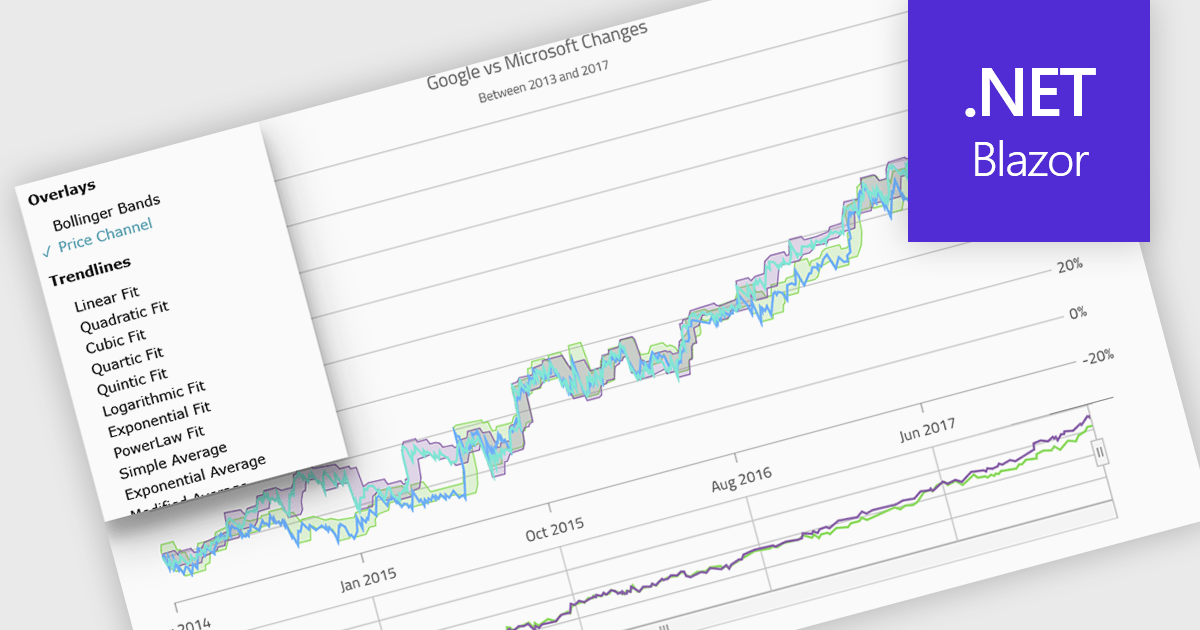
Indicators in a chart component are visual tools used to represent specific statistical or mathematical calculations directly on the chart, often to highlight trends, patterns, or key thresholds within the underlying data. Common in financial and analytical applications, indicators can include elements like moving averages, Bollinger Bands, or threshold lines. For software developers, implementing indicators provides a powerful way to enhance data interpretation by allowing users to see meaningful context and actionable insights without needing to leave the chart interface. This improves decision-making and supports more interactive and informative visualizations across a wide range of use cases.
Several .NET Blazor charting controls support indicators including:
For an in-depth analysis of features and price, visit our comparison of .NET Blazor Chart Controls.
联系电话: (888) 850 9911
传真: +1 770 250 6199


