


官方供应商
我们作为官方授权经销商,直接提供超过200家开发厂家所发行超过1000个的产品授权给您。
查看我们的所有品牌。
继续用英语阅读:
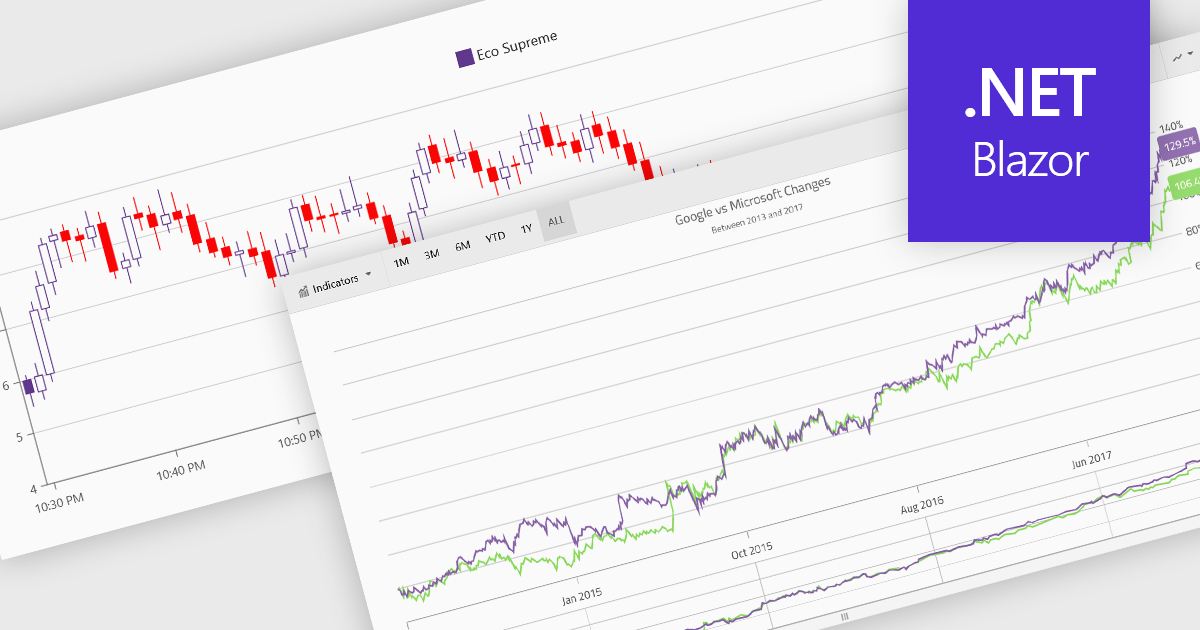
Financial charts are specialized visualizations designed to represent market data and price movements over time. Commonly used in trading platforms and analytical applications, these charts help users interpret open, high, low, and close values, as well as trends and volatility. By providing standardized financial visualizations, charting components enable developers to deliver tools that support technical analysis, decision-making, and real-time data exploration in finance-focused applications.
Common features include:
For an in-depth analysis of features and price, visit our Blazor charts components comparison.
联系电话: (888) 850 9911
传真: +1 770 250 6199


