


官方供应商
我们作为官方授权经销商,直接提供超过200家开发厂家所发行超过1000个的产品授权给您。
查看我们的所有品牌。
继续用英语阅读:
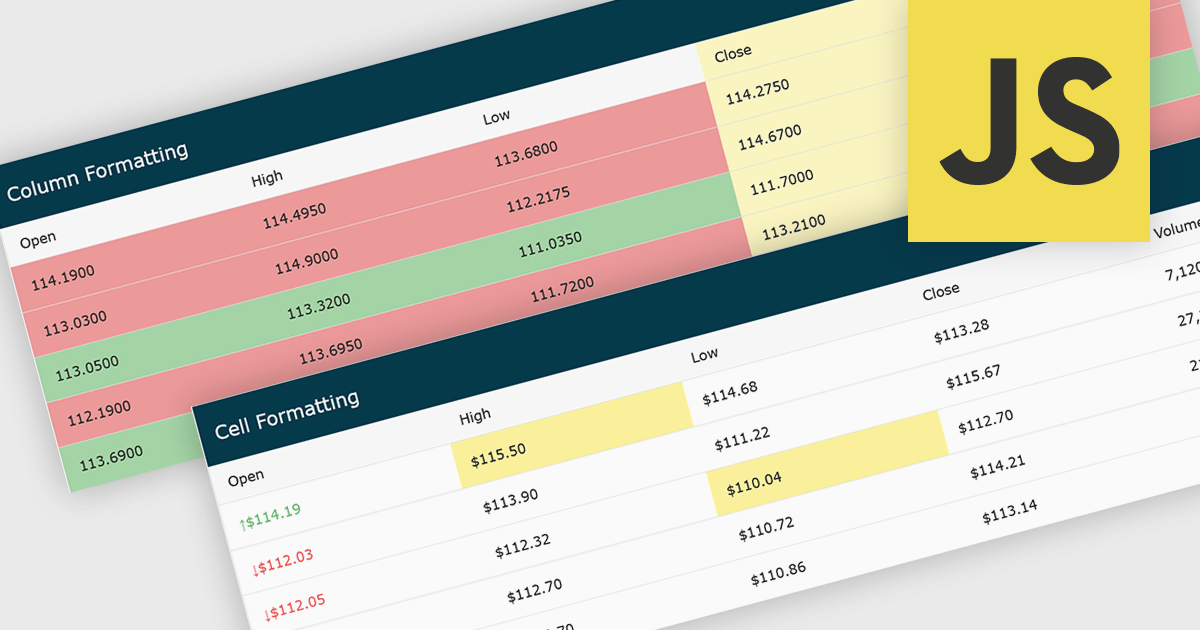
Conditional formatting in grids automatically applies visual styles such as colors or icons based on defined rules, making it easier to interpret large datasets at a glance. It improves readability, highlights patterns and outliers, and supports faster, more informed decision making by surfacing key insights in real time. Common use cases include flagging budget issues in financial reports, emphasizing top performing sales data, monitoring KPIs, and drawing attention to errors or critical statuses in operational tools.
Several JavaScript grid controls offer conditional formatting, including:
For an in-depth analysis of features and price, visit our comparison of JavaScript Grid controls.
联系电话: (888) 850 9911
传真: +1 770 250 6199


