


官方供应商
我们作为官方授权经销商,直接提供超过200家开发厂家所发行超过1000个的产品授权给您。
查看我们的所有品牌。
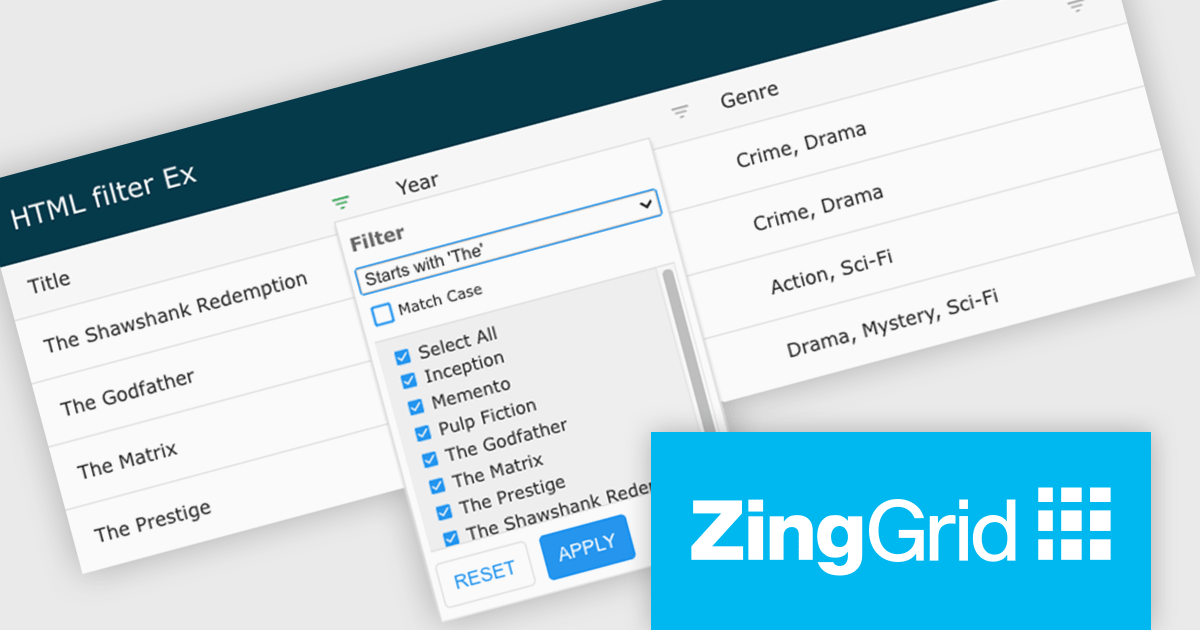
ZingGrid is a JavaScript library that simplifies the creation of interactive data tables and grids within web applications. Utilizing modern web components and focusing on performance and responsiveness, ZingGrid allows developers to implement features like searching, filtering, pagination, and in-line editing with minimal coding. This empowers efficient data visualization and manipulation for users, making it a valuable tool for web development.
Version 1.7.0 adds a rich set of filter conditions, including "contains," "notContains," "equal," "beginsWith," "endsWith," and many more, to pinpoint exactly the information you need. It also empowers you to create custom conditions, ensuring your filtering capabilities perfectly match your data and use case.
To see a full list of what's new in version 1.7.0, see our release notes.
ZingGrid is available as either a Single-Domain Website or Multi-Domain SaaS license. See our ZingGrid licensing page for full details.
For more information, visit our ZingGrid product page.
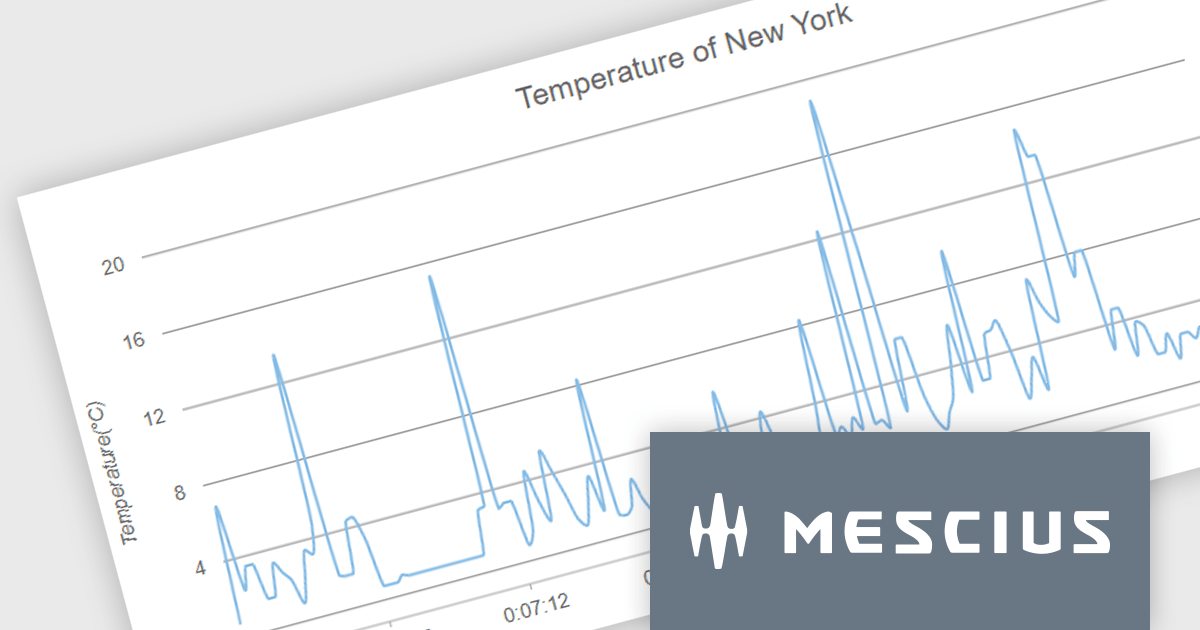
Wijmo by MESCIUS is a comprehensive suite of JavaScript UI controls for building interactive web applications. It offers a wide range of powerful components including grids, charts, inputs, and gauges, designed to streamline development processes and enhance user experiences. With its robust functionality and customizable features, Wijmo simplifies the creation of sophisticated web interfaces, empowering software developers to efficiently craft responsive and visually appealing applications without sacrificing performance or scalability.
The Wijmo 2024 v1 release includes significant rendering refinements for FlexChart and FlexPie. Notable improvements include smoother rounding for polylines and polygons in FlexChart, enhanced spline chart interpolation, and refined tooltips tailored specifically for small slices within FlexPie. These updates collectively enhance the visual quality, precision, and user experience of both chart components, providing developers with finer control over chart aesthetics and data representation.
To see a full list of what's new in 2024 v1, see our release notes.
Wijmo is licensed per developer. Developer Licenses are perpetual and include 1 year Subscription which provides upgrades, including bug fixes and new features. See our Wijmo licensing page for full details.
For more information, visit our Wijmo product page.

Scheduler components in UI Suites offer software developers a pre-built solution for integrating schedulers into applications. These components visually represent calendars or timelines for scheduling appointments, events, or resource allocation. These components often integrate with project management or resource management software.
Several Angular UI Suites feature a scheduler component including:
For an in-depth analysis of features and price, visit our Angular UI Suites comparison.

Thumbnail navigation in JavaScript PDF Viewers enables users to view miniature previews of pages within a PDF document, typically displayed in a sidebar or grid layout. These thumbnails provide users with a visual overview of the document's content, allowing for quick navigation and selection of specific pages.
Several JavaScript PDF Viewer components offer thumbnail navigation including:
For an in-depth analysis of features and price, visit our comparison of JavaScript/HTML5 PDF Viewer Components.
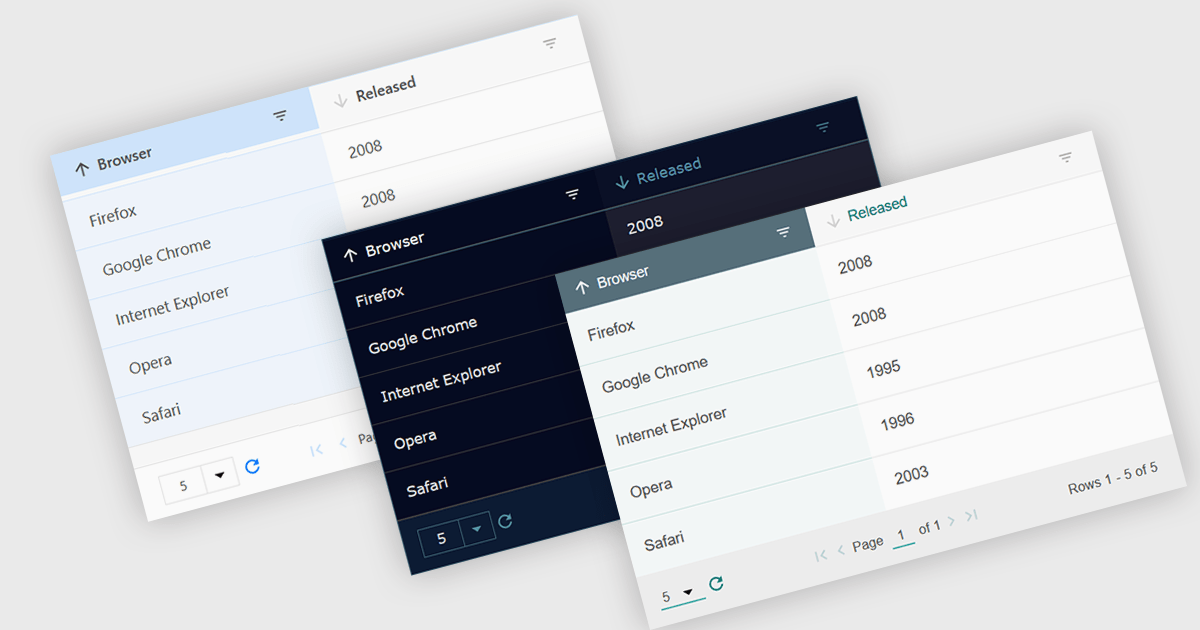
Customizable themes allow users to easily modify the visual appearance of a grid. This typically encompasses aspects like background colors, font styles, cell borders, and hover effects. These themes offer numerous benefits including improving the grid's readability and user experience by aligning it with the application's overall design aesthetic, enhancing data visualization by using color-coding or conditional formatting, and supporting accessibility needs by incorporating high-contrast themes.
Several Vue.js grid controls offer customizable theme support, including:
For an in-depth analysis of features and price, visit our comparison of Vue.js Grid controls.
联系电话: (888) 850 9911
传真: +1 770 250 6199


