


官方供应商
我们作为官方授权经销商,直接提供超过200家开发厂家所发行超过1000个的产品授权给您。
查看我们的所有品牌。
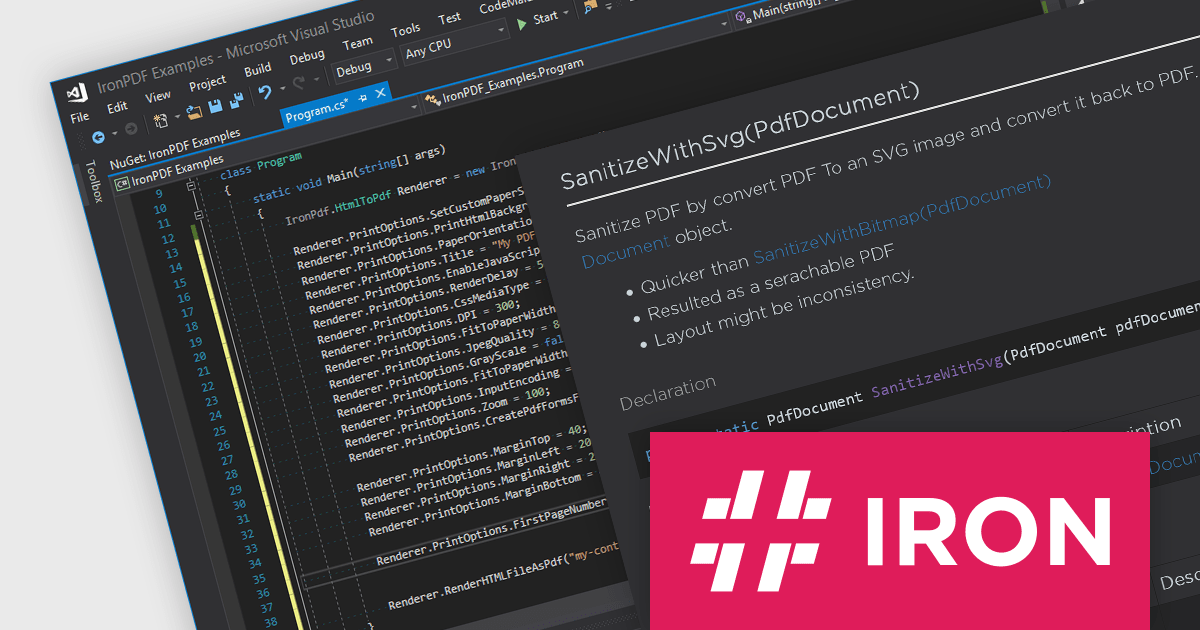
IronPDF for .NET empowers developers with a user-friendly C# library to generate, edit, and manage PDFs. It leverages a familiar HTML/CSS foundation for effortless PDF creation, while also offering robust features like text extraction, OCR, signing, and more. This comprehensive solution simplifies complex PDF development tasks, saving time and boosting productivity for .NET projects.
The IronPDF for .NET 2024.5.2 update introduces the IronPdf.Cleaner API, designed to improve the security and reliability of PDF handling in applications. This new API offers developers the capability to sanitize and scan PDF files, effectively mitigating the risks associated with processing content from an untrusted source. It removes potentially malicious code and sensitive information, such as metadata, comments, or embedded objects, that could compromise the application or user data. This enhances application security and safeguards against potential vulnerabilities introduced through untrusted PDF sources.
To see a full list of what's new in 2024.5.2, see our release notes.
IronPDF for .NET is licensed based on the number of developers, organization locations and projects, and is available as a Perpetual license with one free year of product updates and support services. See our IronPDF for .NET licensing page for full details.
IronPDF for .NET is available to buy in the following products:
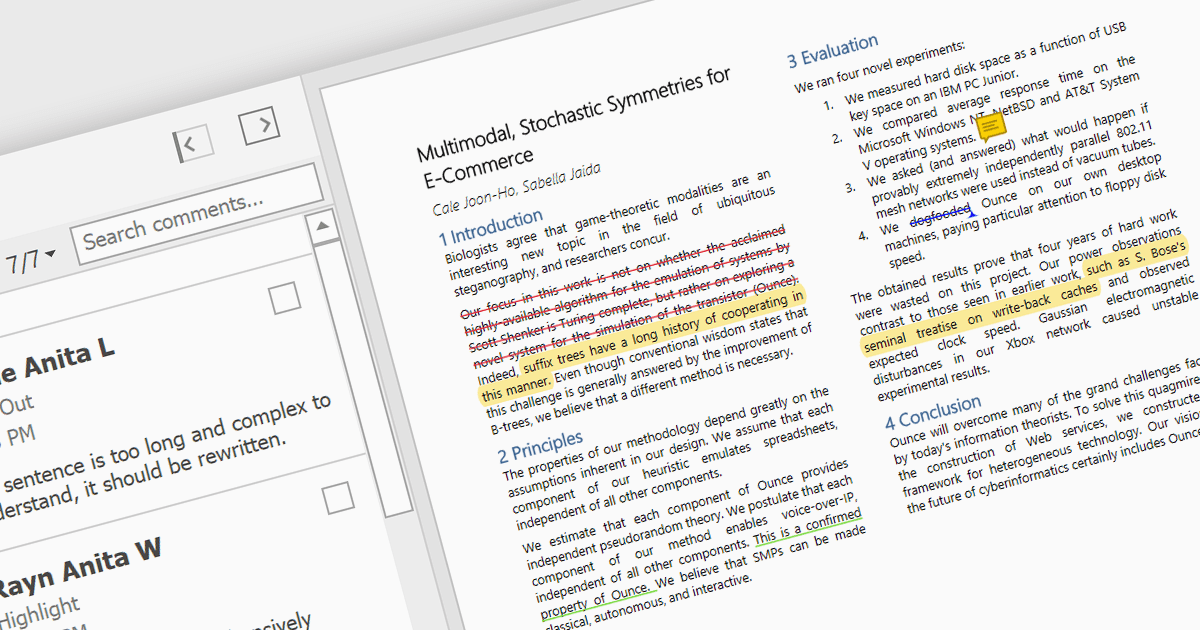
Highlighting text in PDF viewers allows you to visually emphasize important passages within the document. This is achieved by selecting the desired text and applying a colored overlay, typically translucent, to make it stand out from the surrounding text. This functionality is particularly useful for studying, referencing key information, and keeping track of important points during the reading process.
Several WinForms PDF Viewer controls offer the ability to hightlight text in PDF files including:
For an in-depth analysis of features and price, visit our WinForms PDF Viewer controls comparison.
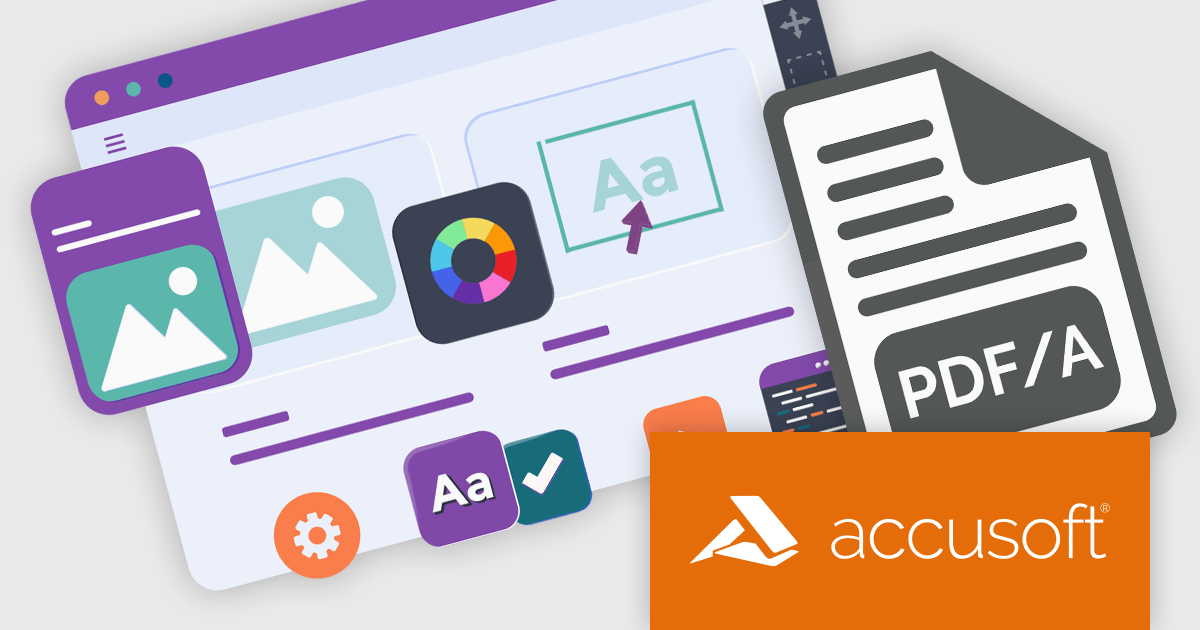
ImageGear for .NET by Accusoft is a development toolkit that empowers you to add robust image processing and document handling functionalities to your .NET applications. It provides comprehensive support for a wide range of file formats, including common image types, PDFs, DICOM medical images, and even Microsoft Office files. ImageGear offers functionalities such as conversion, editing, annotation, viewing, and OCR, streamlining your development process for document-centric applications.
The ImageGear for .NET v26.4.0 update streamlines PDF archiving with the introduction of a RESTful PDF to PDF/A Converter API. This API empowers your applications to seamlessly convert any PDF document into a fully PDF/A compliant archive format. This ensures long-term accessibility and fidelity of your documents, meeting industry standards for preservation.
To see a full list of what's new in v26.4.0, see our release notes.
ImageGear for .NET is licensed per developer and is available as an annual license with 12 months support and upgrades. See our ImageGear for .NET licensing page for full details.
For more information, see our ImageGear for .NET product page.
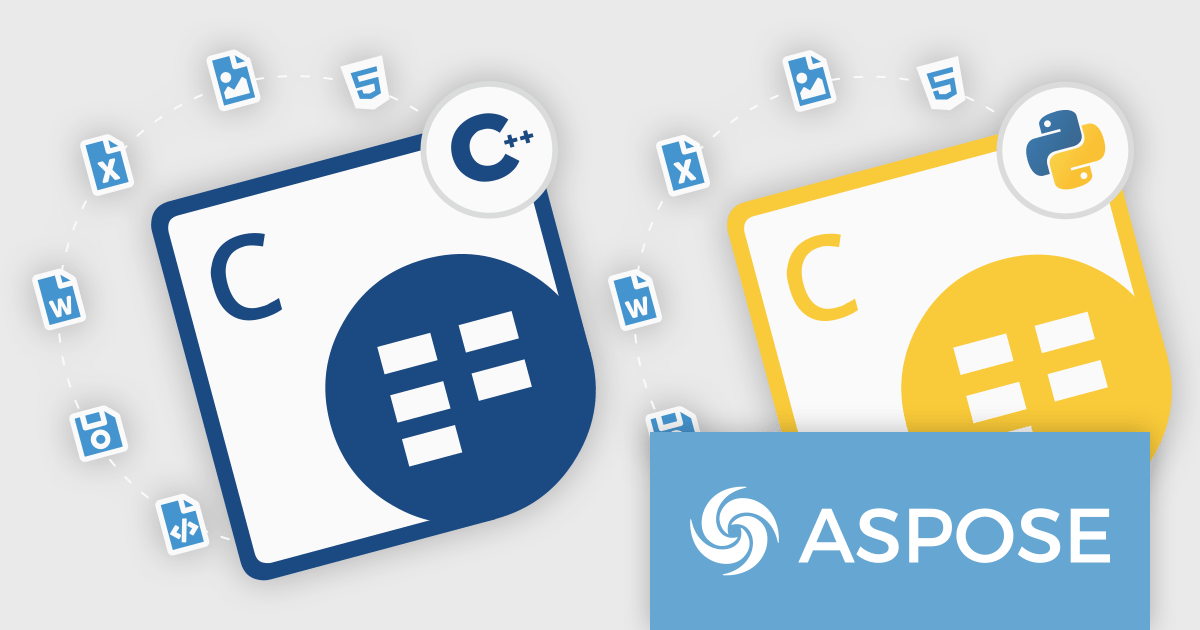
Aspose.Cells is a software development toolkit that empowers developers to work with spreadsheets directly within their applications. It provides functionalities like creating, editing, converting, and rendering spreadsheets in various formats (including Excel, CSV, and PDF) without requiring Microsoft Excel to be installed. This allows developers to seamlessly integrate spreadsheet manipulation into their programs, enhancing their capabilities.
The Aspose.Cells for C++ and Aspose.Cells for Python via .NET 24.4 releases add support for exporting charts from Apple Numbers files to XLSX. This allows developers to seamlessly integrate chart data created in Numbers into Excel spreadsheets, streamlining workflows and data exchange between macOS and Windows environments.
To see a full list of what's new in Aspose.Cells version 24.4, see our C++ and Python via .NET release notes.
Aspose.Cells is offered as Developer Small Business, Developer OEM, Site Small Business, and Site OEM licenses catering to a range of business needs. Licenses are perpetual, and include 1 year of support and maintenance. Subscription renewals are also available. See our Aspose.Cells licensing pages for C++ and Python via .NET for full details.
Aspose.Cells for C++ is available to buy in the following products: Aspose.Cells for C++, Aspose.Cells Product Family, Aspose.Total for C++, and Aspose.Total Product Family.
Aspose.Cells for Python via .NET is available to buy in the following products: Aspose.Cells for Python via .NET, Aspose.Cells Product Family, Aspose.Total for Python via .NET, and Aspose.Total Product Family.
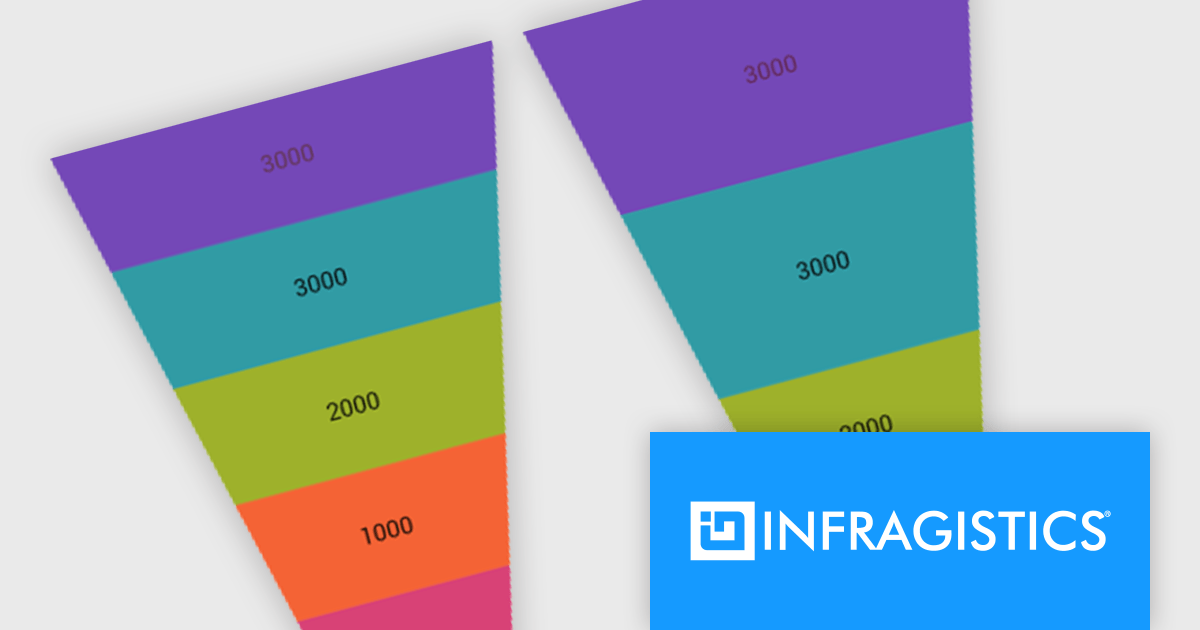
Infragistics Ultimate UI for Windows Forms and Infragistics Ultimate UI for WPF are comprehensive suites of UI controls designed to streamline development and enhance the user experience of desktop applications. Boasting over 100 components, they offer a rich set of functionalities, including data visualization tools, high-performance grids, and modern UI elements that mimic the look and feel of Microsoft Office. These feature-packed libraries empower developers to craft powerful, visually appealing applications with a consistent user experience.
In the latest version, funnel charts can now display a special overlay to highlight specific sections. This highlighting feature allows you to compare the values of different stages in your funnel. You can also control the transparency of the overlay to emphasize the difference between the main data and the highlighted data.
To see a full list of what's new, see our release notes for Infragistics Ultimate UI for Windows Forms and Infragistics Ultimate UI for WPF.
Infragistics Ultimate UI for Windows Forms and Infragistics Ultimate UI for WPF are licensed per developer and are available as a Perpetual License with 1, 2 or 3 year support and maintenance subscription. See our Infragistics Ultimate UI for Windows Forms licensing page or Infragistics Ultimate UI for WPF licensing page for full details.
Infragistics Ultimate UI for Windows Forms is available to buy in the following products:
Infragistics Ultimate UI for WPF is available to buy in the following products:
联系电话: (888) 850 9911
传真: +1 770 250 6199


