


官方供应商
我们作为官方授权经销商,直接提供超过200家开发厂家所发行超过1000个的产品授权给您。
查看我们的所有品牌。

FastReport .NET is a comprehensive reporting solution for .NET applications, offering a wide range of tools for creating, managing, and delivering reports. This software is designed to enable developers to integrate complex reporting functionalities directly into their .NET projects. Key features of FastReport .NET include an intuitive visual report designer, a powerful data processing engine, and support for a variety of export formats such as PDF, Excel, and Word. The product also supports data connectivity from multiple sources, including databases, XML files, and JSON. With its robust scripting capabilities, customizable templates, and ability to generate interactive reports, FastReport .NET provides developers with a versatile toolset for building high-performance, professional-grade reports suitable for business intelligence, data analysis, and presentation needs.
The FastReport .NET 2025.1 update introduces a valuable new feature that allows developers to add a report page as a link, instead of inserting the page into the report. This enhances report modularity and flexibility allowing developers to integrate external report pages into existing reports without duplicating content, simplifying maintenance and updates. By linking report pages, developers can efficiently reuse content across multiple reports, ensuring consistency while reducing the need for repetitive configuration. This feature is particularly advantageous for complex reporting scenarios where maintaining a single source of truth is essential.
To see a full list of what's new in 2025.1, see our release notes.
FastReport .NET is licensed per named user with options for Single, Team or Site Licenses. See our FastReport .NET Component Packages licensing page for full details.
Learn more on our FastReport .NET Component Packages product page.

Support for JSON as a data source in .NET Blazor Grid controls allows developers to efficiently populate grid components with structured data, leveraging JSON's lightweight and easy-to-parse format. This approach enhances flexibility and scalability, as JSON is widely used for data interchange in web applications and can seamlessly integrate with various back-end services and APIs. By utilizing JSON, developers can dynamically bind data to the grid, enabling real-time updates and responsive user interactions. Moreover, JSON's hierarchical structure supports complex data representations, which simplifies the manipulation of nested objects and arrays, ultimately improving data handling within the Blazor framework.
Several .NET Blazor Grid controls offer JSON data source support including:
For an in-depth analysis of features and price, visit our comparison of NET Blazor Grid controls.
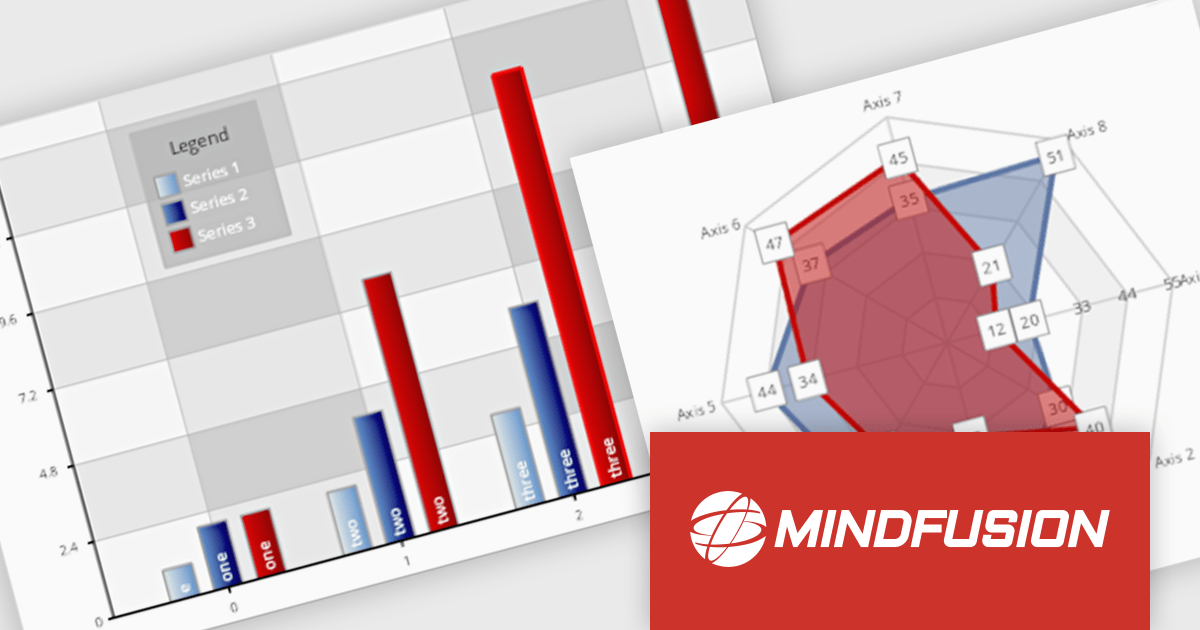
MindFusion.Charting for .NET Blazor is a robust solution that allows developers to effortlessly incorporate a diverse array of interactive and customizable charts and dashboards into Blazor applications. Supporting a wide range of chart types, from basic bar and line charts to more complex visualizations, it simplifies the creation of data-driven web applications. With flexible styling, user-friendly APIs, and smooth rendering, this library is perfect for building dynamic and visually engaging charting solutions in Blazor projects.
MindFusion Charting for .NET Blazor is ideal for building interactive, data-driven applications where dynamic visualization is key. It can be used for dashboards, reports, financial data analysis, performance tracking, and real-time monitoring. With its wide range of chart types, customization options, and user interaction features like pan, zoom, and hit testing, it enables developers to create intuitive, visually appealing interfaces for a variety of industries, including finance, healthcare, education, and business intelligence.
MindFusion.Charting for .NET Blazor is licensed per developer and is available as a perpetual license with 1 year subscription and support. See our MindFusion.Charting for .NET Blazor licensing page for full details.
For more information, visit our MindFusion.Charting for .NET Blazor product page.
Syncfusion Essential Studio Blazor (available as part of Syncfusion Essential Studio Enterprise) is a comprehensive UI component library designed to accelerate the development of high-performance, modern web applications using the Blazor framework. It boasts over 85+ responsive, lightweight, and modular components spanning various categories such as data visualization, data editing, document processing, and interactive UI elements. This rich repertoire empowers developers to rapidly build user-friendly, feature-rich web interfaces, with seamless integration of both server-side and client-side Blazor applications.
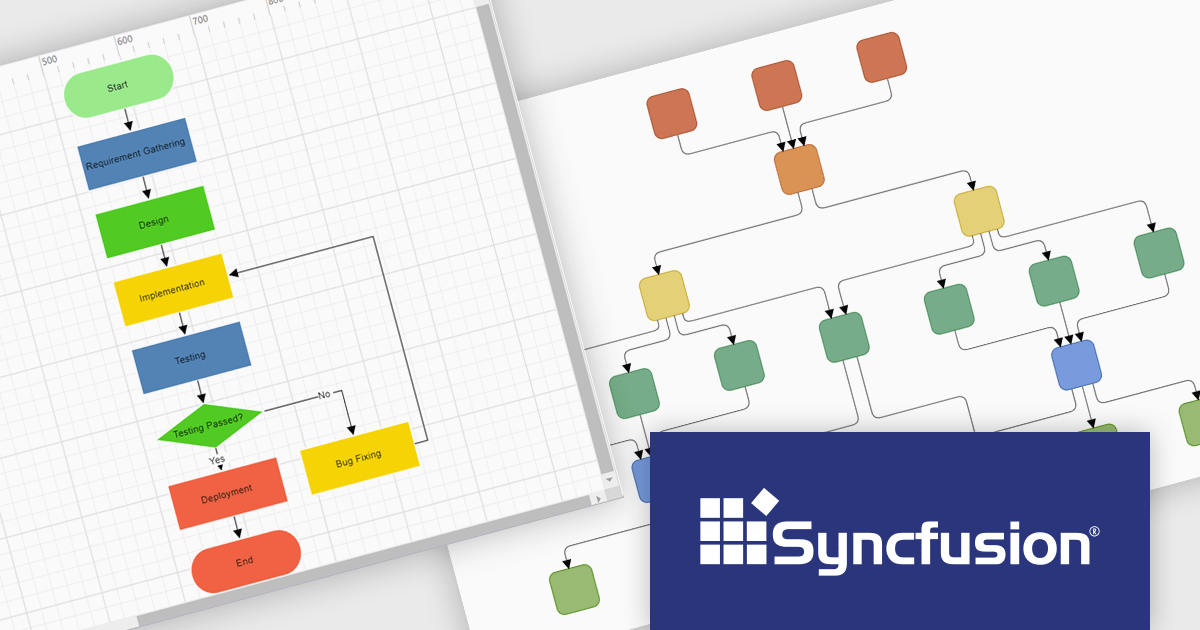
The Syncfusion Essential Studio Enterprise 2024 Volume 3 release introduces the ability to automatically generate clear, logical, and visually appealing flowcharts by arranging nodes and connectors using an advanced layout algorithm. The feature saves time by automating flowchart creation, ensures clarity with logical layouts, enhances visual appeal, and adapts seamlessly to various data inputs, improving overall efficiency.
To see a full list of what's new in 2024 Volume 3, see our release notes.
Syncfusion Essential Studio Blazor is available as part of Syncfusion Essential Studio Enterprise which is licensed per developer starting with a Team License of up to five developers. It is available as a 12 Month Timed Subscription License which includes support and maintenance. See our Syncfusion Essential Studio Enterprise licensing page for full details.
Learn more on our Syncfusion Essential Studio Blazor product page.
Smart UI (formerly known as Smart HTML Elements) is an enterprise-grade UI library offering pre-built web components for developers in Angular, React, Vue, Blazor, and JavaScript. It boasts over 60 ready-to-use components like grids, charts, schedulers, and editors, all featuring two-way data binding, responsiveness, accessibility, and theming capabilities. This library helps developers rapidly build dynamic and modern web applications with consistent look-and-feel and rich functionalities, accelerating development time and ensuring professional quality.
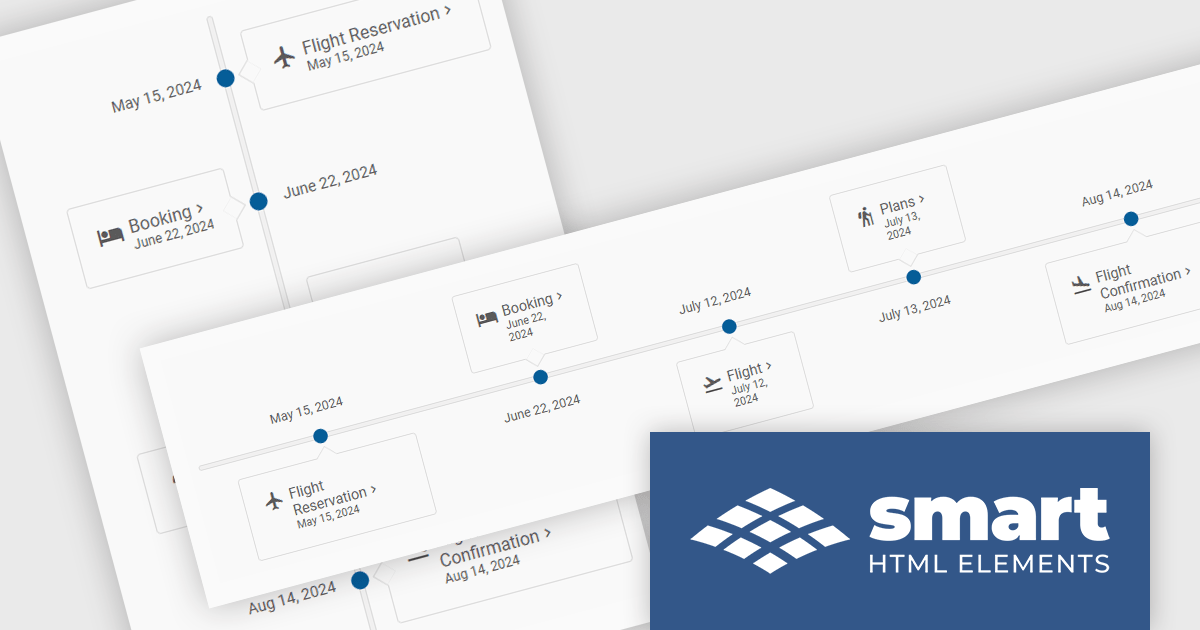
The Smart UI v20.0.0 release includes a new Timeline component which allows you to show a chronological collection of events. You can render the timeline in vertical or horizontal layouts and it can be customized with CSS, enabling you to style it to match your application's branding.
To see a full list of what's new in v20.0.0, see our release notes.
Smart UI (Smart HTML Elements) is licensed per developer and is available as a perpetual license with 1 year support and maintenance. It includes distribution to unlimited Web applications, SaaS projects, Intranets and Websites. Team, OEM and Enterprise licensing options are also available. See our Smart UI licensing page for full details.
Learn more on our Smart UI product page.
联系电话: (888) 850 9911
传真: +1 770 250 6199


